Comparative Study
. 2001 Dec 15;21(24):9944-54.
doi: 10.1523/JNEUROSCI.21-24-09944.2001.

Comparing the functional representations of central and border whiskers in rat primary somatosensory cortex

Affiliations
Comparative Study

Comparing the functional representations of central and border whiskers in rat primary somatosensory cortex

B A Brett-Green et al. J Neurosci. .

Abstract

The anatomical representations of the large facial whiskers, termed barrels, are topographically organized and highly segregated in the posteromedial barrel subfield (PMBSF) of rat layer IV primary somatosensory cortex. Although the functional representations of single whiskers are aligned with their appropriate barrels, their areal extents are rather large, spreading outward from the appropriate barrel along the tangential plane and thereby spanning multiple neighboring and non-neighboring barrels and septal regions. To date, single-whisker functional representations have been characterized primarily for whiskers whose corresponding barrels are located centrally within the PMBSF (central whiskers). Using intrinsic signal imaging verified with post-imaging single-unit recording, we demonstrate that border whiskers, whose barrels are located at the borders of the PMBSF, also evoke large activity areas that are similar in size to those of central whiskers but spread beyond the PMBSF and sometimes beyond primary somatosensory cortex into the neighboring dysgranular zones. This study indicates that the large functional representation of a single whisker is a basic functional feature of the rat whisker-to-barrel system and, combined with results from other studies, suggest that a large functional representation of a small, point-like area on the sensory epithelium may be a functional feature of primary sensory cortex in general.


Figures

Fig. 1.
Fig. 1.
Layer IV CO map. Left, Photomicrograph of a 40 μm tangential section of the rat left cortex through layer IV that has been stained for CO. Dark patches correspond to areas of high CO reactivity.Right, Template of the layer IV CO map created from the tangential section presented in A, with the PMBSF shaded in gray. Regions of high CO reactivity that receive VPM projections corresponding to whisker A2, C2, or E2 are labeled, respectively. T, Trunk; VI, primary visual cortex. SII is located posterolaterally to the PMBSF (data not shown). Orientation applies to both panels;L, lateral; P, posterior. Scale bars, 1 mm.
Fig. 2.
Fig. 2.
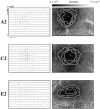
Stimulation of a single central or border whisker evokes a similarly large area of activity. Left column, Spatiotemporal arrays of intrinsic signals evoked by stimulating whisker A2 (top row), C2 (middle row), or E2 (bottom row) in three representative animals are provided. Each trace represents the average intrinsic signal for the underlying 0.35 × 0.35 mm cortical region (10 × 10 pixels) and depicts whisker-evoked changes in light reflectance over 4.5 sec. One second of stimulation is delivered to one whisker after 1 sec of prestimulus activity is collected. By convention, the traces are plotted as upgoing, although cortical activation causes a decrease in light reflectance. Vertical scale bar shown as anarrow: 1 × 10 −3 fractional change; applies to all three left panels. Scale bar, 1 mm. Orientation applies to all six panels; L, lateral;P, posterior. Right column, After data processing, the size of the evoked activity area is quantified using three arbitrary threshold levels away from baseline. The areas quantified with the use of the 1.5, 2.0, and 2.5 × 10⁻⁴ threshold levels correspond to theoutermost, middle, and innermost white outlines, respectively. An eight-bit, linear grayscale map is applied to the processed data so that the cortical region exhibiting evoked activity of at least −2.0 × 10⁻⁴ away from baseline can be visualized as a black patch. Location of peak activity is indicated with a +symbol.
Fig. 3.
Fig. 3.
The size of the functional representation of a whisker is similar between whiskers A2, C2, and E2. A, The area of the functional representation of a whisker as quantified using three threshold levels above baseline is plotted here for 21 rats (n = 7 rats each for whisker A2, C2, and E2). Note the large size of single-whisker functional representations on the order of several squared millimeters. B, The quantified area values after transformation with the square root function.C, Top, Scatterplot of means versus SEs calculated for each subgroup of area values after subdividing the data by whisker type and threshold type. Note the large range of SEs across means, as well as the positive relationship between SEs and means.Bottom, Scatterplot of means versus SEs calculated for each subgroup of transformed area values after subdividing the data by whisker type and threshold type. Note the substantial reduction in the range of SEs across means and the removal of the positive relationship between SEs and means. D, Bar graphs with SEs are provided for the transformed values of the quantified areas of single-whisker functional representations. Although there was a tendency for whisker A2 functional representations to be smaller, a repeated-measures ANOVA on the transformed data found no significant difference between the three whiskers across all thresholds (F(2,18) = 1.94; p= 0.17). All nine possible pairwise comparisons using separate variance unpaired t tests also found no significant difference between any two combinations of whiskers for any threshold (p > 0.05 for all comparisons).
Fig. 4.
Fig. 4.
Significant differences in barrel size between whiskers A2, C2, and E2. A, The quantified barrel size of whiskers A2, C2, and E2 is plotted here for six rats. Note the similar spread in area values between the different whiskers, which satisfies the homogeneity of variance requirement of a repeated-measures ANOVA. B, Means and SEs are provided for the size of A2, C2, and E2 barrels. A repeated-measures ANOVA found a significant difference in barrel size between the three whiskers (F(2,10) = 51.91; p= 0.00001), with the A2 barrel smaller than the C2 barrel, which in turn was smaller than the E2 barrel. *p < 0.05, significant differences between barrel sizes as tested with contrasts.
Fig. 5.
Fig. 5.
Spatial correspondence between the imaging data collected from a curved surface view versus a flat CO map of the PMBSF. A, The functional representation of whisker A2 as quantified at three increasing activity thresholds (black outlines) are superimposed on an image of the blood vessel pattern overlying the curved cortical surface as viewed through the thinned skull by the imaging camera. Also superimposed are the location of peak activity (black cross) and the location of the three electrode penetrations at the point of insertion into the cortical surface (white circles). Scale bar, 1 mm. Orientation applies to all panels; A, anterior;L, lateral. B, Electrolytic lesions in layer IV of the cortex stained for CO confirmed that the first electrode penetration was aligned with the A2 barrel, whereas the second and third penetrations were located at increasing distances away from the A2 barrel in the posterolateral direction toward primary auditory cortex (black arrows). C, After rotating the locations of the electrode penetrations at the cortical surface and positioning the first penetration above the A2 barrel, a good spatial correspondence was found between the locations of the two remaining electrode penetrations at the cortical surface (black circles) and their corresponding electrolytic lesions in layer IV of the cortex, despite the surface curvature of the intact cortex and the shrinkage of cortical tissue after fixation.D, After rotating the imaging data using the same alignment procedure, the rotated imaging data were superimposed on the CO map, revealing that the functional representation of whisker A2 (black outlines) spread outside the PMBSF along the tangential plane into the dysgranular zone separating the PMBSF and primary auditory cortex.
Fig. 6.
Fig. 6.
Single-unit responses evoked by whisker A2 stimulation are present outside the PMBSF in neighboring dysgranular zones. Top panel, Electrode penetrations of a representative animal were aligned with the location of the A2 barrel (P1) and at two additional locations of increasing distance away from the A2 barrel (P2,P3), as verified with electrolytic lesions in layer IV of the PMBSF stained with CO. Scale bar, 1 mm. M, Medial; P, posterior. Examples of PSTHs are provided for single cells recorded in the supragranular layer (right column) to illustrate that the magnitude of single-unit response is strongest above the A2 barrel and decreases in strength with distance from the A2 barrel along the tangential plane. Discrete sampling (0.01 mm2) of intrinsic signals overlying the same locations as the electrode penetrations (left column) exhibit similar properties as single-unit responses in that the magnitude of intrinsic signal response also peaks above the A2 barrel and decays in magnitude over distance. The five dashes near the x-axes depict the delivery of whisker stimulation.

References

    1. Abeles M. Quantification, smoothing, and confidence limits for single-units' histograms. J Neurosci Methods. 1982;5:317–325. - PubMed
    1. Akers RM, Killackey HP. Organization of corticocortical connections in the parietal cortex of the rat. J Comp Neurol. 1978;181:513–537. - PubMed
    1. Armstrong-James M, Fox K. Spatiotemporal convergence and divergence in the rat S1 “barrel” cortex. J Comp Neurol. 1987;263:265–281. - PubMed
    1. Armstrong-James M, Callahan CA, Friedman MA. Thalamo-cortical processing of vibrissal information in the rat. I. Intracortical origins of surround but not centre-receptive fields of layer IV neurones in the rat S1 barrel field cortex. J Comp Neurol. 1991;303:193–210. - PubMed
    1. Armstrong-James M, Fox K, Das-Gupta A. Flow of excitation within rat barrel cortex on striking a single vibrissa. J Neurophysiol. 1992;68:1345–1358. - PubMed

Publication types

LinkOut - more resources