. 2001 Dec;12(12):3717-32.
doi: 10.1091/mbc.12.12.3717.

Na,K-ATPase activity is required for formation of tight junctions, desmosomes, and induction of polarity in epithelial cells

Affiliations
Free PMC article

Na,K-ATPase activity is required for formation of tight junctions, desmosomes, and induction of polarity in epithelial cells

S A Rajasekaran et al. Mol Biol Cell. 2001 Dec.
Free PMC article

Abstract

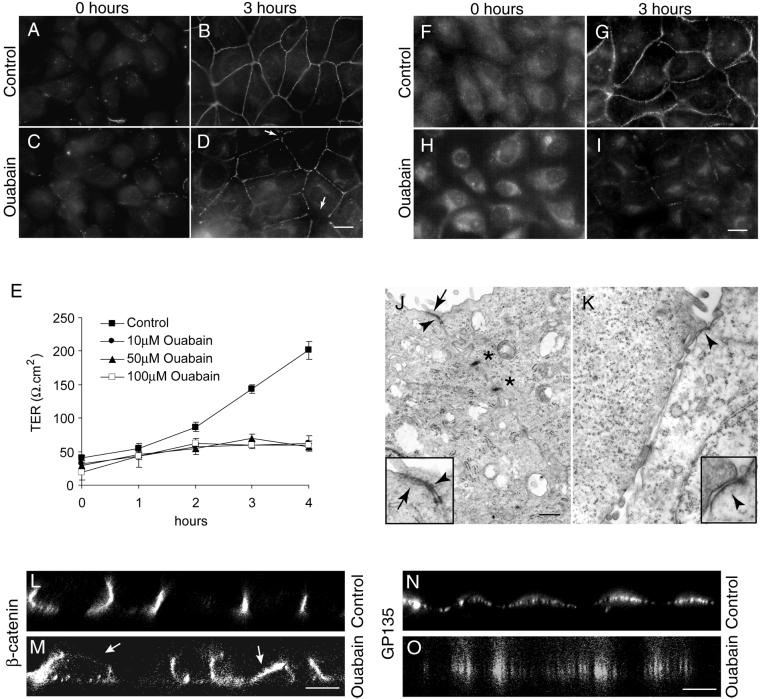
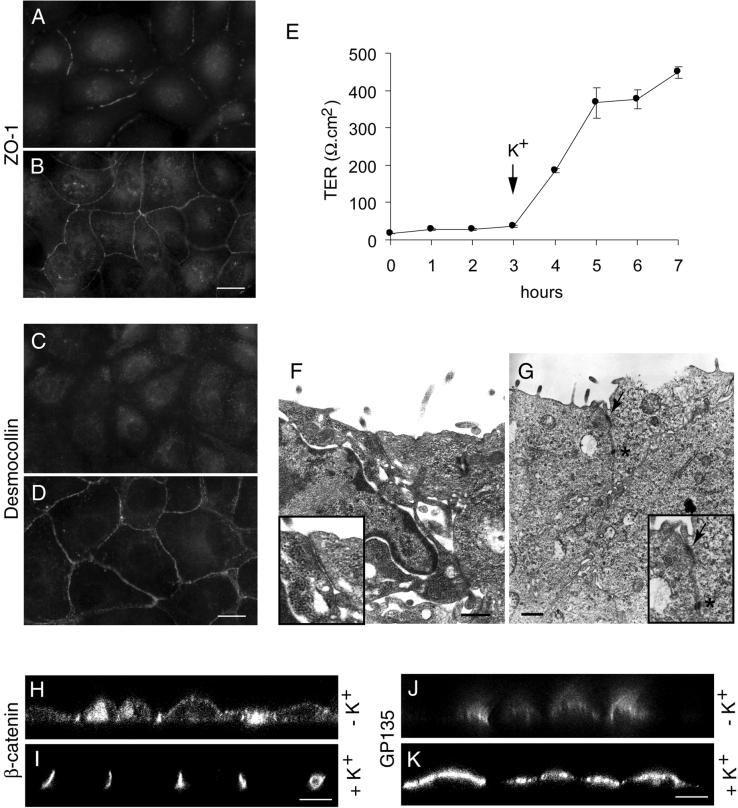
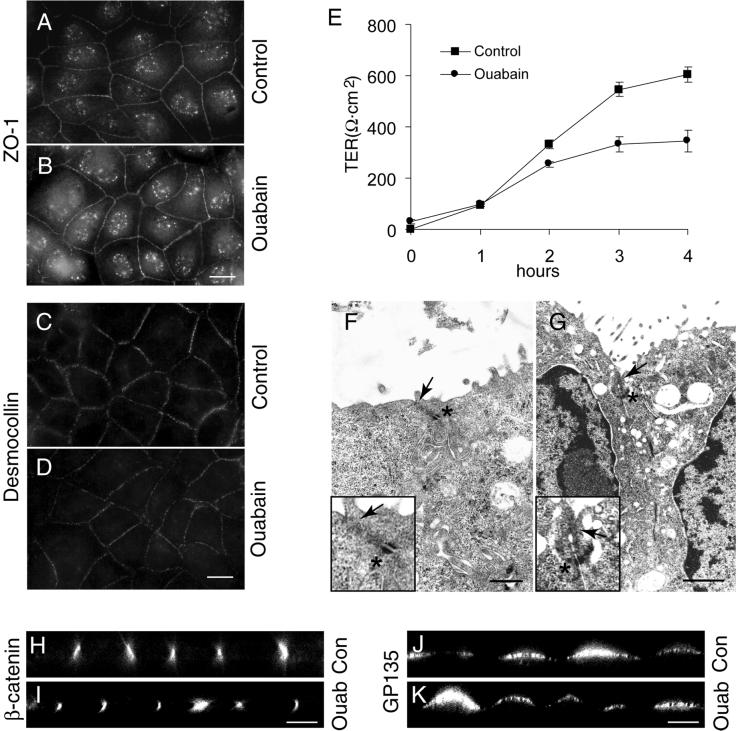
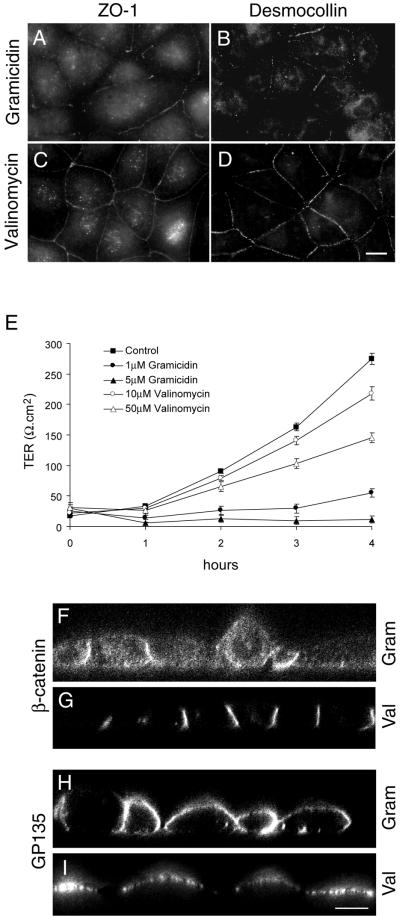
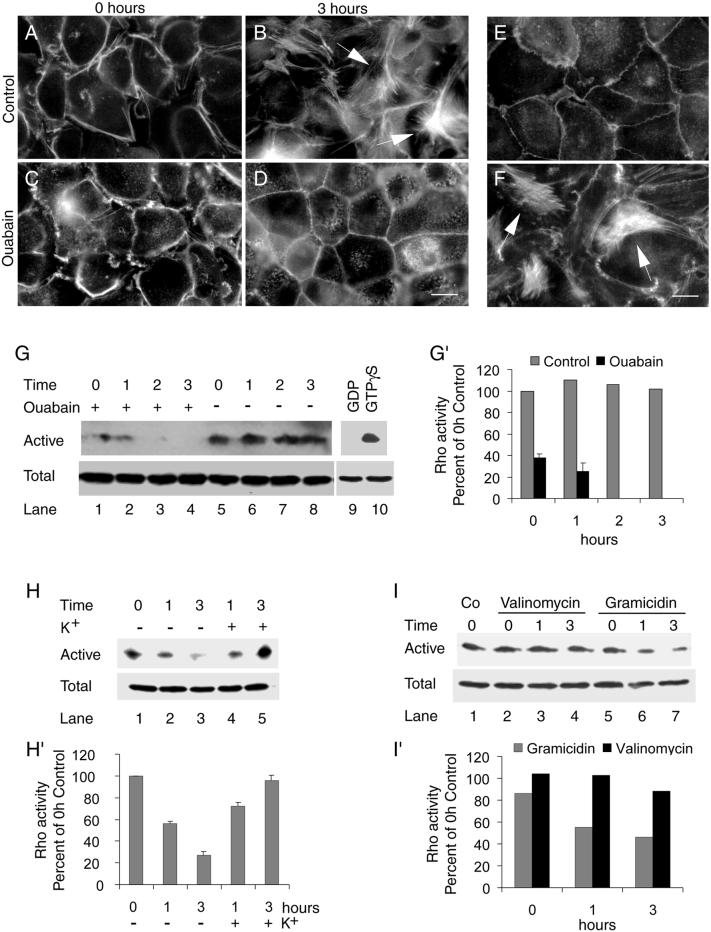
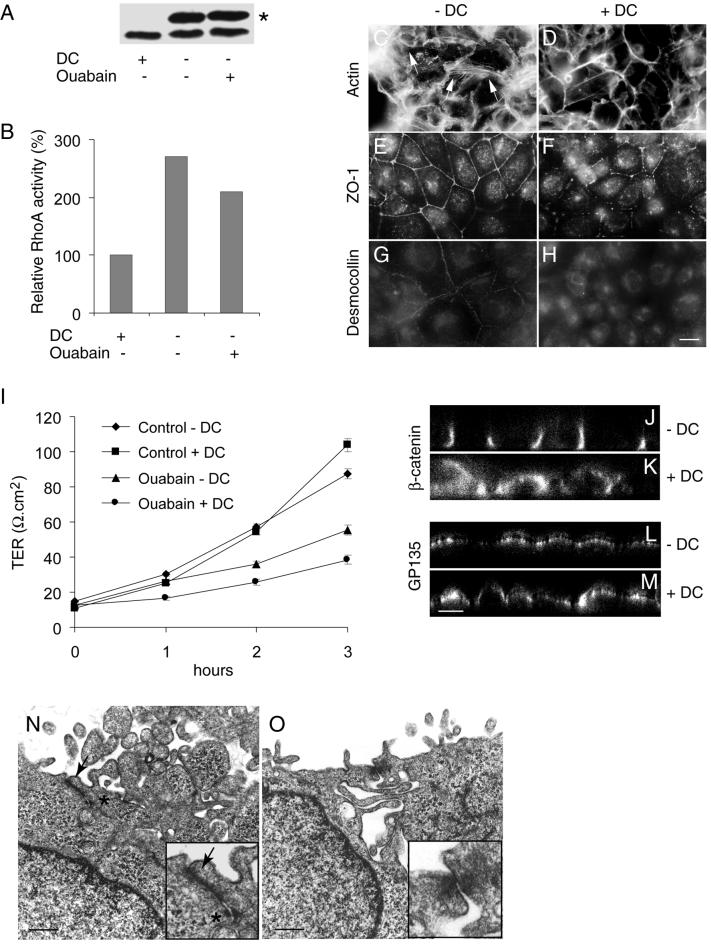
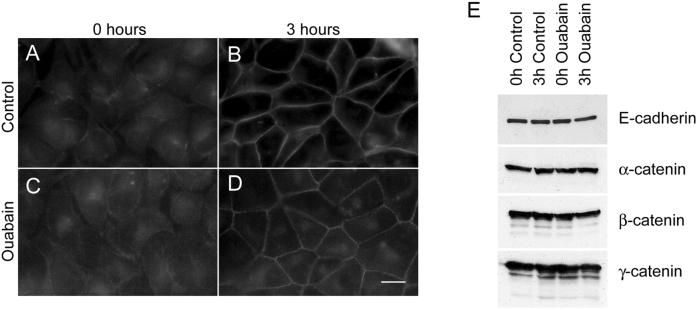
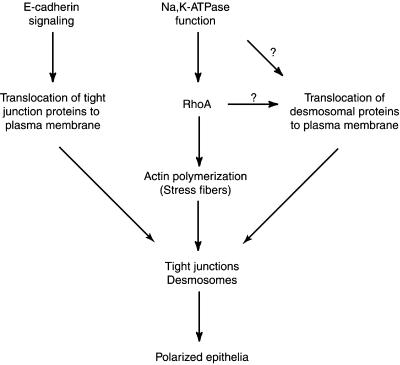
Na,K-ATPase is a key enzyme that regulates a variety of transport functions in epithelial cells. In this study, we demonstrate a role for Na,K-ATPase in the formation of tight junctions, desmosomes, and epithelial polarity with the use of the calcium switch model in Madin-Darby canine kidney cells. Inhibition of Na,K-ATPase either by ouabain or potassium depletion prevented the formation of tight junctions and desmosomes and the cells remained nonpolarized. The formation of bundled stress fibers that appeared transiently in control cells was largely inhibited in ouabain-treated or potassium-depleted cells. Failure to form stress fibers correlated with a large reduction of RhoA GTPase activity in Na,K-ATPase-inhibited cells. In cells overexpressing wild-type RhoA GTPase, Na,K-ATPase inhibition did not affect the formation of stress fibers, tight junctions, or desmosomes, and epithelial polarity developed normally, suggesting that RhoA GTPase is an essential component downstream of Na,K-ATPase-mediated regulation of these junctions. The effects of Na,K-ATPase inhibition were mimicked by treatment with the sodium ionophore gramicidin and were correlated with the increased intracellular sodium levels. Furthermore, ouabain treatment under sodium-free condition did not affect the formation of junctions and epithelial polarity, suggesting that the intracellular Na(+) homeostasis plays a crucial role in generation of the polarized phenotype of epithelial cells. These results thus demonstrate that the Na,K-ATPase activity plays an important role in regulating both the structure and function of polarized epithelial cells.


Figures

Figure 1
Figure 1
Inhibition of Na,K-ATPase activity prevents the formation of tight junctions and desmosomes and the induction of polarity in MDCK cells. (A–D) Immunofluorescence localization of ZO-1. At 0 h in both control (A) and ouabain-treated cells (C), the ZO-1 staining is intracellular. At 3 h ouabain-treated cells show incomplete ZO-1 rings (arrows in D) compared with the complete ring-like staining revealed by control cells (B). (E) Transepithelial electrical resistance measurement. Ouabain-treated cells did not show an increase in the TER over time. (F–I) Immunofluorescence localization of desmocollin. Note that in ouabain-treated cells the desmocollin staining is predominantly intracellular (I) compared with control cells (G). At 0 h in both control (F) and ouabain-treated cells (H) the desmocollin staining is intracellular. (J and K) Transmission electron microscopy. Tight junctions (arrows), adherens junctions (arrowheads), and desmosomes (asterisks) were formed in control cells (J), whereas ouabain-treated cells (K) had no tight junctions and desmosomes. Inserts are the higher magnification of the tight junction regions in J and K. (L–O). Confocal microscope X-Z sections. Note the polarized localization of β-catenin (L) and GP135 (N) in control cells and nonpolarized distribution of these markers in ouabain-treated cells (M and O). Bars in A–D and F–I, 10 μm; J and K, 500 nm; and L–O, 5 μm.
Figure 2
Figure 2
Na,K-ATPase-mediated inhibition of formation of tight junctions and desmosomes is reversible. Immunofluorescence localization of ZO-1 (A and B) and desmocollin (C and D). Cells incubated in K+-free medium show an incomplete ZO-1 ring at the plasma membrane region (A) and intracellular localization of desmocollin (C). Replenishment of K+ results in a complete ZO-1 ring (B) and plasma membrane localization of desmocollin (D). (E) Measurement of TER. Note an increase in the TER as soon as the cells are shifted to K+-containing medium. (F and G) Transmission electron microscopy. Note the absence of tight junctions (arrow) and desmosomes (asterisk) in K+-free medium (F) and their presence in K+-containing medium (G). Insets in F and G are the higher magnifications of tight junction regions. (H–K) Confocal microscope X-Z sections. Note the nonpolarized distribution of β-catenin (H) and GP135 (J) under K+-depleted condition and the polarized distribution of β-catenin (I) and GP135 (K) after K+ repletion. Bars in A–D, 10 μm; F and G, 500 nm; and H–K, 5 μm.
Figure 3
Figure 3
Ouabain treatment under sodium-free conditions does not affect the formation of tight junctions and desmosomes. A and B and C and D are the immunofluorescence localization of ZO-1 and desmocollin, respectively. Note the comparable staining pattern in control (A and C) and ouabain-treated (B and D) cells. (E) Measurement of TER. (F and G) Transmission electron micrographs of control (F) and ouabain-treated (G) cells show tight junctions (arrow) and desmosomes (asterisk). Insets are the higher magnification of the tight junction region in F and G. (H–K) Confocal microscope X-Z sections. Note the polarized distribution of β-catenin and GP135 in control and ouabain-treated cells. Bars in A–D, 10 μm; F and G, 500 nm and 1 μm, respectively; and H–K, 5 μm.
Figure 4
Figure 4
Treatment of MDCK cells with the sodium ionophore gramicidin inhibits the formation of tight junctions. (A and C) Immunofluorescence localization of ZO-1 and desmocollin (B and D), respectively, of gramicidin- (A and B) and valinomycin (C and D)-treated cells. (E). TER measurement of gramicidin- and valinomycin-treated cells. (F–I) Confocal microscope X-Z sections. Bars in A–D, = 10 μm; F–I, 5 μm.
Figure 5
Figure 5
Inhibition of Na,K-ATPase prevents the formation of bundled stress fibers and inhibits RhoA GTPase activity. (A–F) FITC-phalloidin staining of filamentous actin. At 0 h no stress fibers were detected in control cells (A) and cells treated with ouabain (C). Bundled stress fibers were present at 3 h in control cells (B, arrows) but were not detected in ouabain-treated cells (D). Phalloidin labeling of cells maintained under K+-free condition (E) and cells transferred to K+-containing medium (F) are shown. Note the presence of bundled stress fibers (arrows) after transfer to K+-containing medium. Bars in A–F, 10 μm. (G and G′) Effect of ouabain treatment on RhoA activity. (G) Immunoblot showing active and total RhoA in ouabain-treated and control cells. The results shown are the representative data obtained from three independent experiments. (G′) Quantification of the immunoblot data represents the average of three independent determinations done in duplicate. Bars indicate the SE. For control the error bars are so small that they are not seen in the figure. (H and H′) Effect of K+ depletion and repletion on the RhoA activity. Immunoblot of active and total RhoA (H) and quantification of the immunoblot data (H′) representing the mean of two independent determinations done in duplicate. (I and I′) Effect of gramicidin and valinomycin on RhoA activity. Immunoblot of total and active RhoA (I) and quantification of the immunoblot data done in duplicate (I′).
Figure 6
Figure 6
Formation of tight junctions, desmosomes and the induction of polarity in ouabain-treated MDCK-RhoAwt cells overexpressing RhoA. −DC and +DC represent ouabain-treated induced and noninduced MDCK-RhoAwt cells, respectively. (A) RhoA immunoblot showing induced high molecular mass Myc-tagged (∗) and endogenous RhoA after the withdrawal of DC. (B) Relative levels of active RhoA GTPase. The results shown are the representative data obtained from two independent experiments. (C and D) FITC-phalloidin staining of filamentous actin. Note the presence of bundled stress fibers in C and their absence in D. (E and F) Immunofluorescence of ZO-1. Ouabain-treated induced cells show a complete ring-like staining compared with the incomplete ZO-1 ring in noninduced cells. (G and H) Immunofluorescence of desmocollin. In ouabain-treated induced cells desmocollin is localized to the plasma membrane compared with the intracellular staining in noninduced cells (I). Measurement of TER (J–M). Confocal microscope X-Z sections. Note the polarized distribution of β-catenin and GP135 in ouabain-treated induced cells. (N and O) Transmission electron microscopy. Tight junctions (arrow) and desmosomes (asterisk) are present in ouabain-treated induced cells. Inserts are the higher magnification of the tight junction region in N and O. Bars in C–H, 10 μm; J–M, 5 μm; and N and O, 500 nm.
Figure 7
Figure 7
E-Cadherin and catenin expression in ouabain-treated MDCK cells. (A–D) Immunofluorescence of E-cadherin. At 0 h E-cadherin was localized intracellular in both control (A) and ouabain-treated (C) cells. At 3 h E-cadherin was localized on the plasma membrane in control cells (B) and in ouabain-treated cells (D). (E) Immunoblot analysis of E-cadherin, α-catenin, β-catenin, and γ-catenin. Ouabain treatment of MDCK cells during Ca2+-switch did not significantly alter the expression levels of E-cadherin, α-catenin, β-catenin, or γ-catenin. Bar, 10 μm.
Figure 8
Figure 8
Schematic model of the formation of tight junctions and desmosomes in epithelial cells (see text for details).

Similar articles

Cited by

References

    1. Balda MS, Whitney JA, Flores C, Gonzalez S, Cereijido M, Matter K. Functional dissociation of paracellular permeability and transepithelial electrical resistance and disruption of the apical-basolateral intramembrane diffusion barrier by expression of a mutant tight junction membrane protein. J Cell Biol. 1996;134:1031–1049. - PMC - PubMed
    1. Buffin-Meyer B, Marsy S, Barlet-Bas C, Cheval L, Younes-Ibrahim M, Rajerison R, Doucet A. Regulation of renal Na+,K+-ATPase in rat thick ascending limb during K+-depletion: evidence for modulation of Na+ affinity. J Physiol. 1996;490:623–632. - PMC - PubMed
    1. Contreras RG, Shoshani L, Flores-Maldonado C, Lazaro A, Cereijido M. Relationship between Na+,K+-ATPase and cell attachment. J Cell Sci. 1999;112:4223–4232. - PubMed
    1. Farquhar MG, Palade GE. Junctional complexes in various epithelia. J Cell Biol. 1963;17:375–412. - PMC - PubMed
    1. Fernandez R, Malnic G. H+ ATPase and Cl− interaction in regulation of MDCK cell pH. J Membr Biol. 1998;163:137–145. - PubMed

Publication types

MeSH terms

LinkOut - more resources