

G2/M arrest caused by actin disruption is a manifestation of the cell size checkpoint in fission yeast
- PMID: 11739788
- PMCID: PMC60763
- DOI: 10.1091/mbc.12.12.3892
G2/M arrest caused by actin disruption is a manifestation of the cell size checkpoint in fission yeast
Abstract
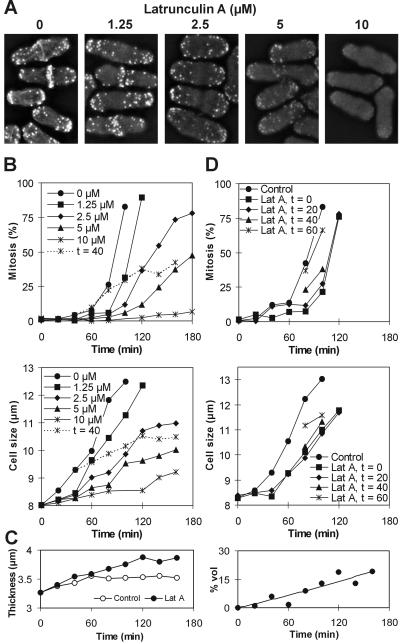
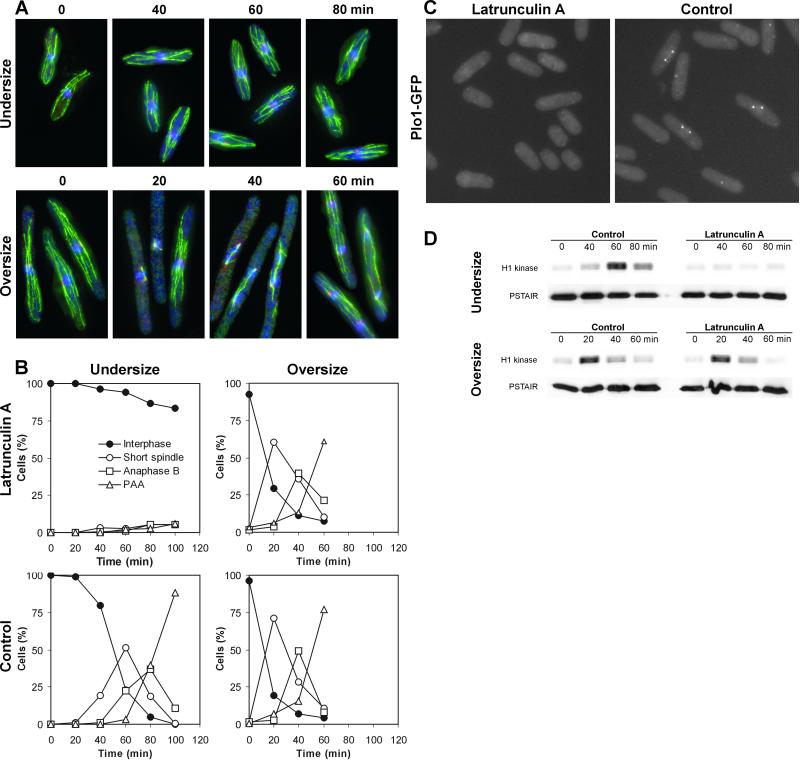
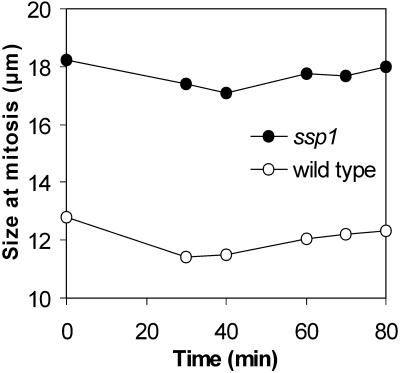
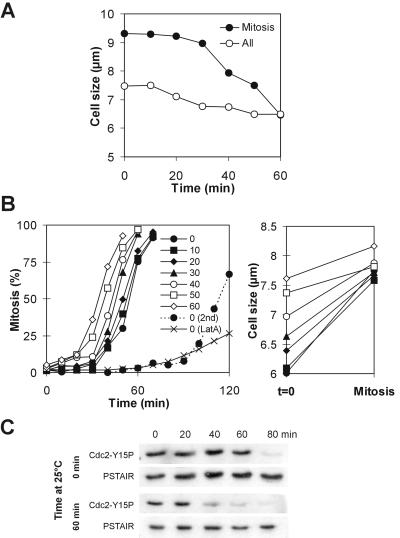
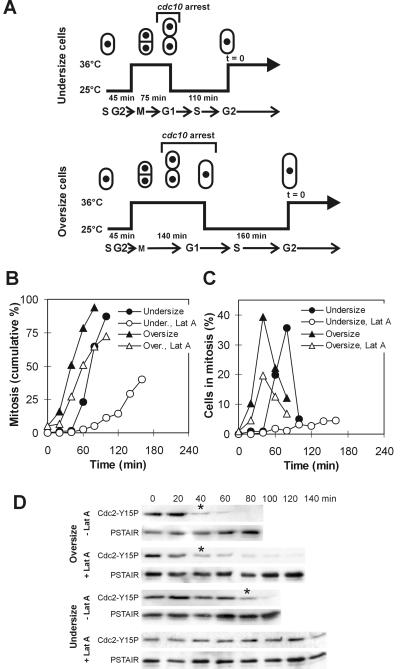
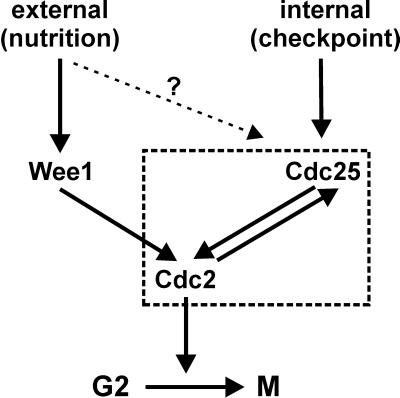
In budding yeast, actin disruption prevents nuclear division. This has been explained as activation of a morphogenesis checkpoint monitoring the integrity of the actin cytoskeleton. The checkpoint operates through inhibitory tyrosine phosphorylation of Cdc28, the budding yeast Cdc2 homolog. Wild-type Schizosaccharomyces pombe cells also arrest before mitosis after actin depolymerization. Oversized cells, however, enter mitosis uninhibited. We carried out a careful analysis of the kinetics of mitotic initiation after actin disruption in undersized and oversized cells. We show that an inability to reach the mitotic size threshold explains the arrest in smaller cells. Among the regulators that control the level of the inhibitory Cdc2-Tyr15 phosphorylation, the Cdc25 protein tyrosine phosphatase is required to link cell size monitoring to mitotic control. This represents a novel function of the Cdc25 phosphatase. Furthermore, we demonstrate that this cell size-monitoring system fulfills the formal criteria of a cell cycle checkpoint.
Figures


Similar articles
-
HIV-1 Vpr induces cell cycle G2 arrest in fission yeast (Schizosaccharomyces pombe) through a pathway involving regulatory and catalytic subunits of PP2A and acting on both Wee1 and Cdc25.Virology. 2001 Sep 1;287(2):359-70. doi: 10.1006/viro.2001.1007. Virology. 2001. PMID: 11531413
-
Cdc25 mitotic inducer targeted by chk1 DNA damage checkpoint kinase.Science. 1997 Sep 5;277(5331):1495-7. doi: 10.1126/science.277.5331.1495. Science. 1997. PMID: 9278510
-
Stockpiling of Cdc25 during a DNA replication checkpoint arrest in Schizosaccharomyces pombe.Mol Cell Biol. 1996 Jan;16(1):86-93. doi: 10.1128/MCB.16.1.86. Mol Cell Biol. 1996. PMID: 8524332 Free PMC article.
-
Viral infections and cell cycle G2/M regulation.Cell Res. 2005 Mar;15(3):143-9. doi: 10.1038/sj.cr.7290279. Cell Res. 2005. PMID: 15780175 Review.
-
Controlling cell cycle progress in the fission yeast Schizosaccharomyces pombe.Curr Opin Genet Dev. 1991 Oct;1(3):307-12. doi: 10.1016/s0959-437x(05)80292-8. Curr Opin Genet Dev. 1991. PMID: 1840886 Review.
Cited by
-
The nuclear kinase Lsk1p positively regulates the septation initiation network and promotes the successful completion of cytokinesis in response to perturbation of the actomyosin ring in Schizosaccharomyces pombe.Mol Biol Cell. 2005 Jan;16(1):358-71. doi: 10.1091/mbc.e04-06-0502. Epub 2004 Nov 10. Mol Biol Cell. 2005. PMID: 15537703 Free PMC article.
-
The Interference of Selected Cytotoxic Alkaloids with the Cytoskeleton: An Insight into Their Modes of Action.Molecules. 2016 Jul 12;21(7):906. doi: 10.3390/molecules21070906. Molecules. 2016. PMID: 27420038 Free PMC article.
-
Cucurbitacins: elucidation of their interactions with the cytoskeleton.PeerJ. 2017 May 30;5:e3357. doi: 10.7717/peerj.3357. eCollection 2017. PeerJ. 2017. PMID: 28584704 Free PMC article.
-
Linkers of cell polarity and cell cycle regulation in the fission yeast protein interaction network.PLoS Comput Biol. 2012;8(10):e1002732. doi: 10.1371/journal.pcbi.1002732. Epub 2012 Oct 18. PLoS Comput Biol. 2012. PMID: 23093924 Free PMC article.
-
Effects of 3D microwell culture on growth kinetics and metabolism of human embryonic stem cells.Biotechnol Appl Biochem. 2012 Mar-Apr;59(2):88-96. doi: 10.1002/bab.1003. Epub 2012 Feb 23. Biotechnol Appl Biochem. 2012. PMID: 23586789 Free PMC article.
References
-
- Alfa C, Fantes P, Hyams J, McLeod M, Warbrick E. Experiments with Fission Yeast. A Laboratory Course Manual. Cold Spring Harbor, NY: Cold Spring Harbor Laboratory Press; 1993.
-
- Ammar DA, Nguyen PN, Forte JG. Functionally distinct pools of actin in secretory cells. Am J Physiol. 2001;281:C407–C417. - PubMed
-
- Belenguer P, Pelloquin L, Oustrin M-L, Ducommun B. Role of the fission yeast nim1 protein kinase in the cell cycle response to nutritional signals. Biochem Biophys Res Commun. 1997;232:204–208. - PubMed
Publication types
MeSH terms
Substances
LinkOut - more resources
Full Text Sources
Research Materials
Miscellaneous
