. 2002 Jan;70(1):207-23.
doi: 10.1086/338304. Epub 2001 Dec 6.

Molecular analysis of the beta-globin gene cluster in the Niokholo Mandenka population reveals a recent origin of the beta(S) Senegal mutation

Affiliations

Molecular analysis of the beta-globin gene cluster in the Niokholo Mandenka population reveals a recent origin of the beta(S) Senegal mutation

Mathias Currat et al. Am J Hum Genet. 2002 Jan.

Abstract

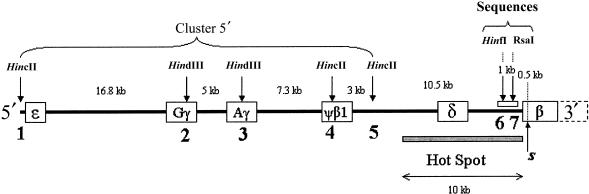
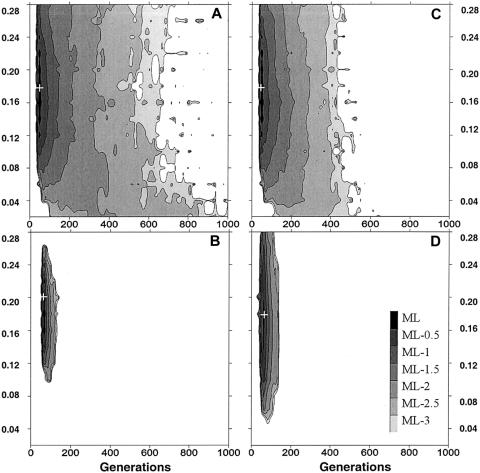
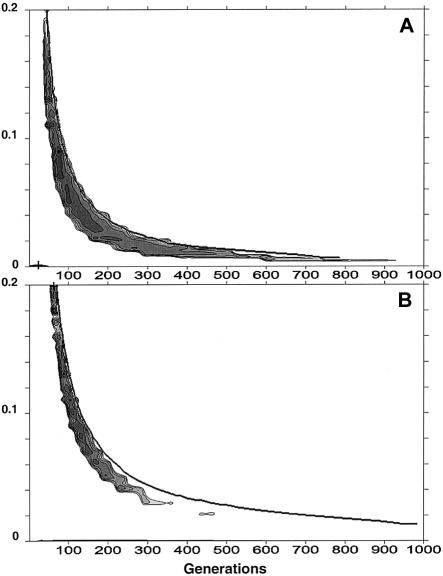
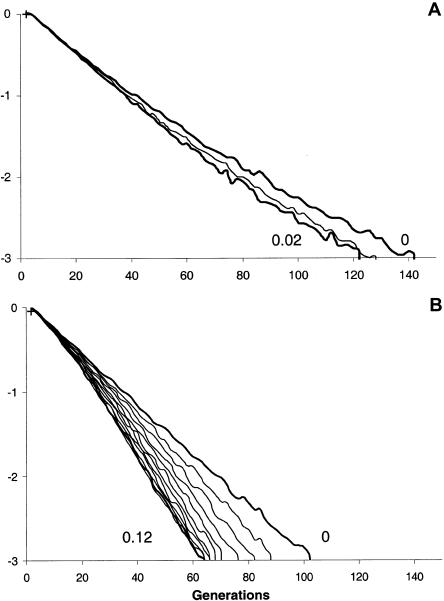
A large and ethnically well-defined Mandenka sample from eastern Senegal was analyzed for the polymorphism of the beta-globin gene cluster on chromosome 11. Five RFLP sites of the 5' region were investigated in 193 individuals revealing the presence of 10 different haplotypes. The frequency of the sickle-cell anemia causing mutation (beta(S)) in the Mandenka estimated from this sample is 11.7%. This mutation was found strictly associated with the single Senegal haplotype. Approximately 600 bp of the upstream region of the beta-globin gene were sequenced for a subset of 94 chromosomes, showing the presence of four transversions, five transitions, and a composite microsatellite polymorphism. The sequence of 22 beta(S) chromosomes was also identical to the previously defined Senegal haplotype, suggesting that this mutation is very recent. Monte Carlo simulations (allowing for a specific balancing selection model, a logistic growth of the population, and variable initial frequencies of the Senegal haplotype) were used to estimate the age of the beta(S) mutation. Resulting maximum-likelihood estimates are 45-70 generations (1,350-2,100 years) for very different demographic scenarios. Smallest confidence intervals (25-690 generations) are obtained under the hypothesis that the Mandenka population is large (N(e) >5,000) and stationary or that it has undergone a rapid demographic expansion to a current size of >5,000 reproducing individuals, which is quite likely in view of the great diversity found on beta(A) chromosomes.


Figures

Figure  1
Figure 1
Map of the human β-globin gene cluster on chromosome 11. The location of the five polymorphic RFLP sites that define the 5′ RFLP cluster haplotypes are shown by arrows and numbers 1–5. The sequenced region between positions −1069 and −391 is indicated as a white bar.
Figure  2
Figure 2
Likelihood surface of the age of the βS mutation obtained by Monte Carlo simulation of the spread of a new mutation. Simulated data correspond to sequence data in which no diversity is found in 22 βS chromosomes. The mutation rate is 5 × 10⁻⁴ per generation, when calculated as an average for dinucleotide microsatellites (Goldstein et al. 1995) and taken for the whole sequence. The estimated recombination rate between the βS mutation and the sequence data is 8 × 10⁻⁵ per generation. A, Stationary population N = 1,000. B, Stationary population N = 10,000. C, Logistic growth, N0 = 1,000, K = 10,000, r = 0.001. D, Logistic growth, N0 = 1,000, K = 10,000, r = 0.02. Plus sign (+) indicates the ML estimator.
Figure  3
Figure 3
Likelihood surface of the age of the βS mutation, obtained by Monte Carlo simulation of the spread of a new mutation. The neutral linked marker corresponds to the 5′ RFLP cluster data in which no diversity is found in 45 βS chromosomes. When the estimation given by Harding et al. (1997) is used, the estimated mutation rate is 1 × 10⁻⁶ per generation taken as average for 30 bp. The estimated recombination rate between the βS mutation and the 5′ RFLP cluster is 1.6 × 10⁻³ per generation (Chakravarti et al. 1984). A, Stationary population N = 1,000. B, Stationary population N = 10,000. C, Logistic growth, N0 = 1,000, K = 10,000, r = .001. D, Logistic growth, N0 = 1,000, K = 10,000, r = 0.02. Plus sign (+) indicates the ML estimator.
Figure  4
Figure 4
Plot of the likelihood obtained by the BDMC method for the age of the βS mutation for different total growth rates (ξ) of βS chromosomes in a present-day population of 10,000 individuals (A) and in a population of 1 million individuals (B). The assumed mutation rate is 5 × 10⁻⁴, and no diversity is observed among 22 chromosomes. The present frequency of the βS mutation is taken as 11.7%. The shaded regions delimit a parameter space for which the log likelihood is three units smaller than the ML, which corresponds approximately to a joint 95% CI for the growth rate and the age of the mutation. The plus sign indicates the ML estimator. The 95% CI for the age of the βS mutation (0–900 generations) does not correspond exactly to that reported in table 4 (0–1,200 generations), because we have plotted interpolated values, whereas the figures reported in table 4 are based on exact values.
Figure  5
Figure 5
Likelihood of the age of the βS mutation, (estimated according to the DMLE method, under the assumption that 45 βS chromosomes show the same associated 5′ cluster RFLP haplotype despite a recombination rate of 1.6 × 10⁻³ per generation (Chakravarti et al. 1984). The present population is assumed to be either (A) 10,000 or (B) 1 million individuals. Likelihoods are plotted for total exponential growth rates (see text) ranging from 0% per generation (extreme right line) to the largest one that permits retention of at least one βS chromosome in the population in the whole CI (see DMLE subsection) (extreme left line) by increments of 1%. The DMLE method gives an ML value of one generation. An upper limit for the age of the βS mutation is found when the log-likelihood of that age is three units less than the maximum.

Similar articles

Cited by

References

Electronic-Database Information

    1. Bruce Rannala's Research Group, http://www.rannala.org/ (for DMLE and BDMC21)
    1. Statistics, http://www.reading.ac.uk/Statistics/genetics/software.html/ (for hwmetc software)

References

    1. Antonarakis SE, Boehm CD, Giardina PJ, Kazazian HH Jr (1982) Nonrandom association of polymorphic restriction sites in the β-globin gene cluster. Proc Natl Acad Sci USA 79:137–141 - PMC - PubMed
    1. Antonarakis SE, Boehm CD, Serjeant GR, Theisen CE, Dover GJ, Kazazian HH Jr (1984) Origin of the beta S-globin gene in blacks: the contribution of recurrent mutation or gene conversion or both. Proc Natl Acad Sci USA 81:853–856 - PMC - PubMed
    1. Antonarakis SE, Kazazian HH Jr, Orkin SH (1985) DNA polymorphism and molecular pathology of the human globin gene clusters. Hum Genet 69:1–14 - PubMed
    1. Ayala FJ, Escalante AA, Rich SM (1999) Evolution of Plasmodium and the recent origin of the world populations of Plasmodium falciparum. Parassitologia 41:55–68 - PubMed
    1. Ayres KL, Balding DJ (1998) Measuring departures from Hardy-Weinberg: a Markov chain Monte Carlo method for estimating the inbreeding coefficient. Heredity 80:769–777 - PubMed

Publication types

MeSH terms