. 2002 Jan;184(1):152-64.
doi: 10.1128/JB.184.1.152-164.2002.

Metabolic flux responses to pyruvate kinase knockout in Escherichia coli

Affiliations

Metabolic flux responses to pyruvate kinase knockout in Escherichia coli

Marcel Emmerling et al. J Bacteriol. 2002 Jan.

Abstract

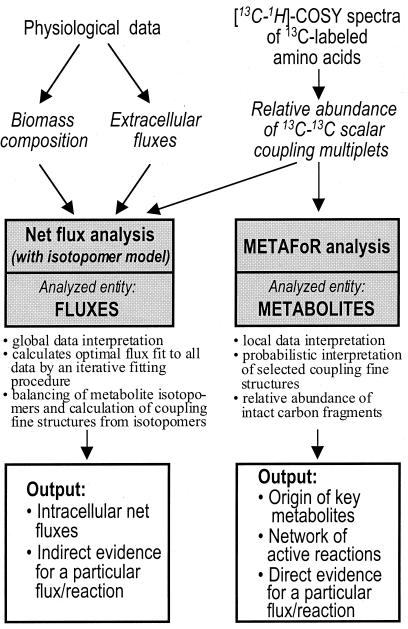
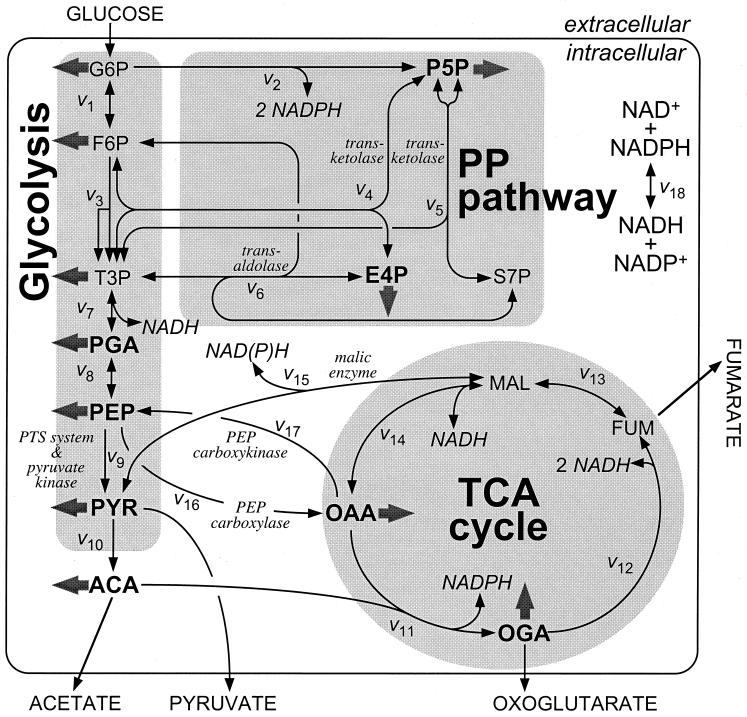
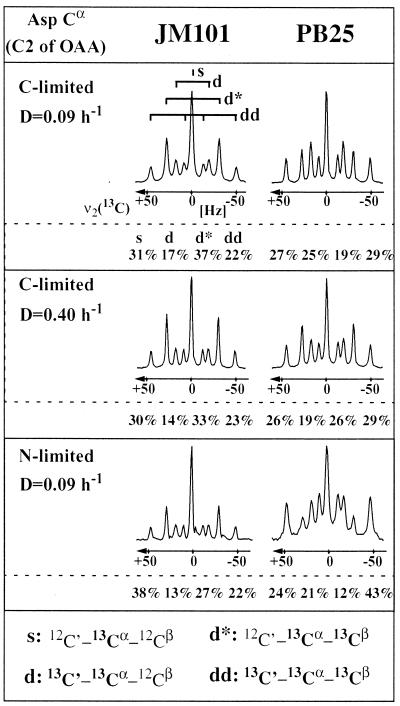
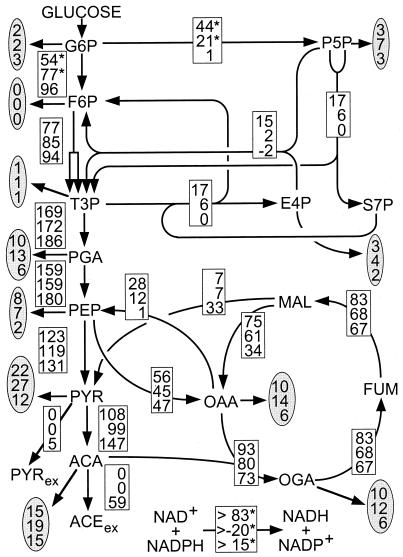
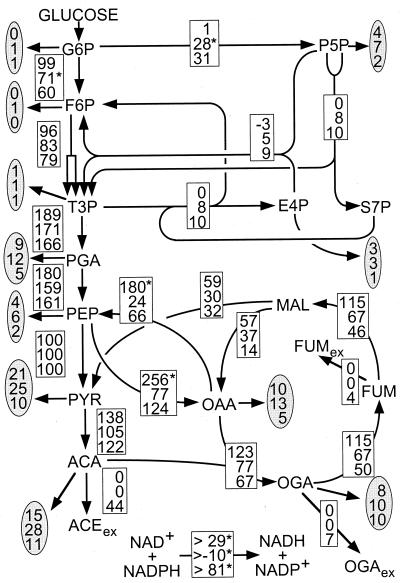
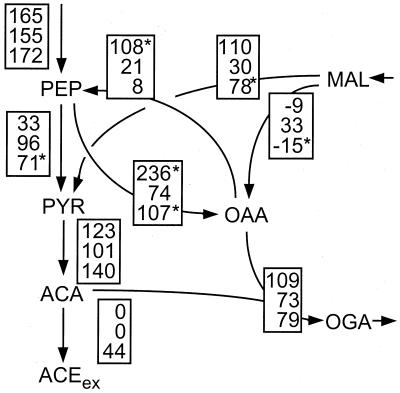
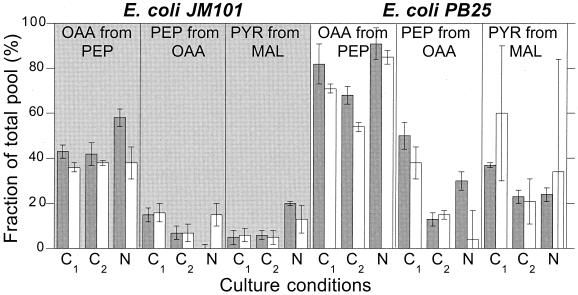
The intracellular carbon flux distribution in wild-type and pyruvate kinase-deficient Escherichia coli was estimated using biosynthetically directed fractional 13C labeling experiments with [U-13C6]glucose in glucose- or ammonia-limited chemostats, two-dimensional nuclear magnetic resonance (NMR) spectroscopy of cellular amino acids, and a comprehensive isotopomer model. The general response to disruption of both pyruvate kinase isoenzymes in E. coli was a local flux rerouting via the combined reactions of phosphoenolpyruvate (PEP) carboxylase and malic enzyme. Responses in the pentose phosphate pathway and the tricarboxylic acid cycle were strongly dependent on the environmental conditions. In addition, high futile cycling activity via the gluconeogenic PEP carboxykinase was identified at a low dilution rate in glucose-limited chemostat culture of pyruvate kinase-deficient E. coli, with a turnover that is comparable to the specific glucose uptake rate. Furthermore, flux analysis in mutant cultures indicates that glucose uptake in E. coli is not catalyzed exclusively by the phosphotransferase system in glucose-limited cultures at a low dilution rate. Reliability of the flux estimates thus obtained was verified by statistical error analysis and by comparison to intracellular carbon flux ratios that were independently calculated from the same NMR data by metabolic flux ratio analysis.


Figures

FIG. 1.
FIG. 1.
Flow chart for metabolic flux ratio (METAFoR) and metabolic net flux analysis. Input information for the calculations is italicized.
FIG. 2.
FIG. 2.
Bioreaction network of E. coli central carbon metabolism. Arrows indicate the assumed reaction reversibility or irreversibility. Fluxes to biomass building blocks are indicated by solid arrows. The isotopomer distribution in bold metabolites is directly accessible by [13C,1H]-COSY NMR of amino acids. Abbreviations: G6P, glucose-6-phosphate; F6P, fructose-6-phosphate; P5P, pentose phosphates; PP pathway, pentose phosphate pathway; E4P, erythrose-4-phosphate; S7P, seduheptulose-7-phosphate; T3P, triose-3-phosphate; PGA, 3-phosphoglycerate; ACA, acetyl-coenzyme A; ACE, acetate; OGA, 2-oxoglutarate; PYR. pyruvate; FUM, fumarate; MAL, malate; OAA, oxaloacetate; and PTS system, PEP:carbohydrate phosphotransferase system for glucose uptake.
FIG. 3.
FIG. 3.
13C-13C scalar coupling multiplets in the cross-sections of Cα in aspartate from [13C,1H]-COSY NMR of amino acids isolated from glucose (C)- or ammonia (N)-limited chemostat cultures of E. coli JM101 and PB25 after biosynthetically directed fractional 13C labeling. As indicated in the top left cross-section, the multiplets consist of a singlet (s) representing the 12C′–13Cα12Cβ isotopomer, a doublet (d) originating from 12C′–13Cα13Cβ, a second doublet (d*) for 13C′–13Cα12Cβ, and a doublet of doublets (dd) arising from 13C′–13Cα13Cβ. In each panel, the relative abundances of the different isotopomers are indicated. The relative abundances of the different components reflect the metabolic state of the organism. They are the directly observed parameters used for calculating with probabilistic equations (48) the relative abundances of intact carbon fragments originating from a single source molecule of glucose. Aspartate corresponds directly to its metabolic precursor oxaloacetate (OAA).
FIG. 4.
FIG. 4.
Metabolic flux distribution in chemostat cultures of E. coli JM101. The chemostats were operated under glucose limitation at a D of 0.09 (top entry in the boxes) and 0.40 h−1 (middle) or under ammonia limitation at a D of 0.09 h−1 (bottom). Flux values are relative to the specific glucose uptake rate and represent the mean of five to eight independent flux calculations that were initiated from random starting points. The maximum deviation among these independent calculations was 6, 8, and 3% of the specific glucose uptake rate for the top, middle, and bottom flux estimates given in the boxes, respectively. The only exceptions are fluxes marked by an asterisk, where the maximum deviation was 20% for the fluxes that branch off glucose-6-phosphate in the glucose-limited cases and less than 40% in the transhydrogenase fluxes. The χ2 values (representing the quality of the fit) of the top, middle, and bottom flux estimates were 67, 46, and 160, respectively. Arrows indicate the direction of the estimated fluxes. Extracellular metabolites are denoted by the subscript ex, and fluxes into biomass are given in the shaded ovals. For abbreviations, see the legend to Fig. 2.
FIG. 5.
FIG. 5.
Simulation of the correlation between exchange flux and metabolite pool composition. For simplicity, a single reversible reaction was simulated in steady state. The metabolite obtained from the exchange reaction exhibits a different 13C-labeling pattern than metabolites that were not (yet) converted by this reaction, such as, for example, in carboxylation reactions where unlabeled C from carbon dioxide is introduced.
FIG. 6.
FIG. 6.
Metabolic flux distribution in chemostat cultures of pyruvate kinase-deficient E. coli PB25, assuming stoichiometric conversion of PEP to pyruvate with glucose uptake via the PTS system. The chemostats were operated under glucose limitation at D values of 0.08 (top entry in the boxes) and 0.40 h−1 (middle) or under ammonia limitation at D = 0.08 h−1 (bottom). Flux values are relative to the specific glucose uptake rate and represent the mean of five to eight independent flux calculations that were initiated from random starting points. The maximum deviation of these independent calculations was 2, 4, and 5% of the specific glucose uptake rate for the top, middle, and bottom flux estimates given in the boxes, respectively. Fluxes marked by asterisks deviated by at most 20%. The χ2 values of the top, middle, and bottom flux estimates were 200, 47, and 509, respectively. The arrows indicate the direction of the estimated fluxes. Extracellular metabolites are denoted by the subscript ex, and fluxes into biomass are given in the shaded ovals. For abbreviations, see the legend to Fig. 2.
FIG. 7.
FIG. 7.
Metabolic flux distribution at the glycolysis-TCA cycle interface in chemostat cultures of pyruvate kinase-deficient E. coli PB25 calculated without any a priori assumptions on the activities of pyruvate kinase and the PTS system. This analysis was done with the experimental data used in Fig. 6 to elucidate whether our method identifies a reduced flux from PEP to pyruvate without explicitly including the pyruvate kinase knockout in the model. Flux values are relative to the specific glucose uptake rate and represent the mean of five to eight independent flux calculations that were initiated from random starting points. The maximum deviation of these independent calculations was 6, 6, and 2 to 8% of the specific glucose uptake rate for the top, middle, and bottom flux estimates given in the boxes, respectively. Fluxes marked by asterisks deviated by maximally 20%. The χ2 values of the top, middle, and bottom flux estimates were 105, 46, and 450, respectively. The arrows indicate the direction of the estimated fluxes. Extracellular metabolites are denoted by the subscript ex. For abbreviations, see the legend to Fig. 2.
FIG. 8.
FIG. 8.
Comparison of metabolic flux ratios obtained from METAFoR analysis (white bars) (Table 3) or calculated from the estimated net flux distribution (gray bars) (Fig. 3 and 4) of E. coli JM101 (shaded background) and PB25 (white background). The chemostat culture conditions were glucose limitation at D = 0.09 (C1) and D = 0.40 h−1 (C2) and ammonia limitation at D = 0.09 h−1 (N). For abbreviations, see the legend to Fig. 2.

References

    1. Abdel-Hamid, A. M., M. M. Attwood, and J. R. Guest. 2001. Pyruvate oxidase contributes to the aerobic growth efficiency of Escherichia coli. Microbiology 147:1483–1498. - PubMed
    1. Bäck, T., and H.-P. Schwefel. 1993. An overview of evolutionary algorithms for parameter optimization. Evol. Comp. 1:1–23.
    1. Bergmeyer, J., and M. Grassl. 1983. Enzymes 1: oxidoreductases, transferases. Verlag Chemie, Weinheim, Germany.
    1. Bergmeyer, J., and M. Grassl. 1984. Metabolites 1: carbohydrates. Verlag Chemie, Weinheim, Germany.
    1. Boonstra, B., C. E. French, I. Wainwright, and N. C. Bruce. 1999. The udhA gene of Escherichia coli encodes a soluble pyridine nucleotide transhydrogenase. J. Bacteriol. 181:1030–1034. - PMC - PubMed

Publication types

LinkOut - more resources