. 2002 Jan;184(1):290-301.
doi: 10.1128/JB.184.1.290-301.2002.

Biofilm formation and dispersal under the influence of the global regulator CsrA of Escherichia coli

Affiliations

Biofilm formation and dispersal under the influence of the global regulator CsrA of Escherichia coli

Debra W Jackson et al. J Bacteriol. 2002 Jan.

Abstract

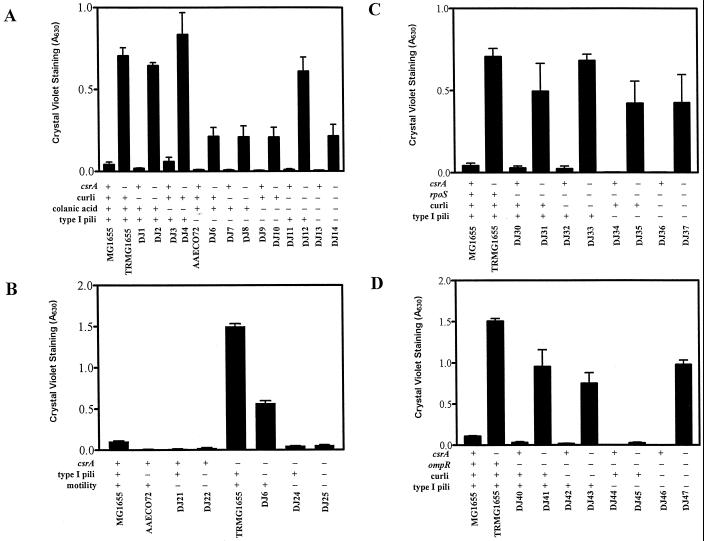
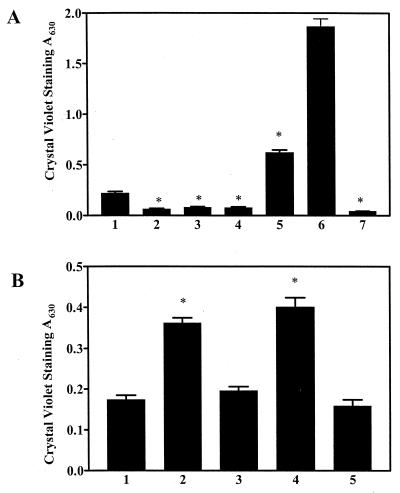
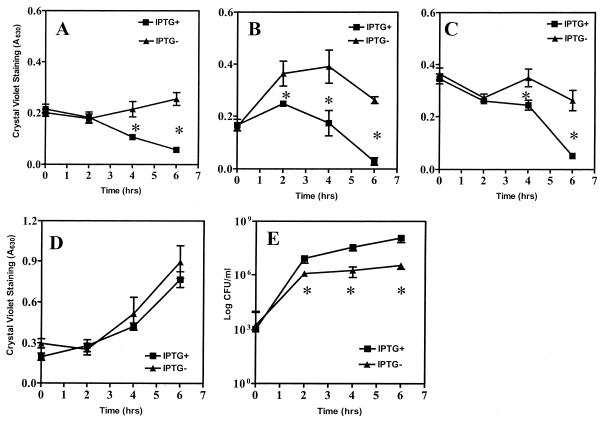
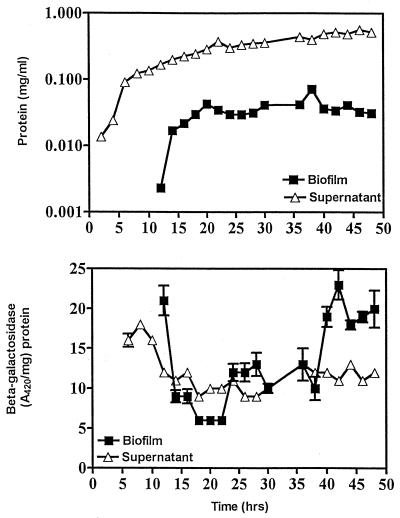
The predominant mode of growth of bacteria in the environment is within sessile, matrix-enclosed communities known as biofilms. Biofilms often complicate chronic and difficult-to-treat infections by protecting bacteria from the immune system, decreasing antibiotic efficacy, and dispersing planktonic cells to distant body sites. While the biology of bacterial biofilms has become a major focus of microbial research, the regulatory mechanisms of biofilm development remain poorly defined and those of dispersal are unknown. Here we establish that the RNA binding global regulatory protein CsrA (carbon storage regulator) of Escherichia coli K-12 serves as both a repressor of biofilm formation and an activator of biofilm dispersal under a variety of culture conditions. Ectopic expression of the E. coli K-12 csrA gene repressed biofilm formation by related bacterial pathogens. A csrA knockout mutation enhanced biofilm formation in E. coli strains that were defective for extracellular, surface, or regulatory factors previously implicated in biofilm formation. In contrast, this csrA mutation did not affect biofilm formation by a glgA (glycogen synthase) knockout mutant. Complementation studies with glg genes provided further genetic evidence that the effects of CsrA on biofilm formation are mediated largely through the regulation of intracellular glycogen biosynthesis and catabolism. Finally, the expression of a chromosomally encoded csrA'-'lacZ translational fusion was dynamically regulated during biofilm formation in a pattern consistent with its role as a repressor. We propose that global regulation of central carbon flux by CsrA is an extremely important feature of E. coli biofilm development.


Figures

FIG. 1.
FIG. 1.
Biofilm formation by wild-type and csrA mutant strains of E. coli. (A) Growth in polystyrene microtiter wells of planktonic cells of the wild-type strain MG1655 (filled squares) or its csrA mutant (filled triangles). Biofilm formation in the same wells is shown as open squares or triangles, respectively. (B) Nomarski interference of biofilm formed by MG1655 in the left panels (10, 16, and 24 h, top to bottom) or its csrA mutant in the right panels (3, 10, and 24 h). OD600, optical density at 600 nm.
FIG. 1.
FIG. 1.
Biofilm formation by wild-type and csrA mutant strains of E. coli. (A) Growth in polystyrene microtiter wells of planktonic cells of the wild-type strain MG1655 (filled squares) or its csrA mutant (filled triangles). Biofilm formation in the same wells is shown as open squares or triangles, respectively. (B) Nomarski interference of biofilm formed by MG1655 in the left panels (10, 16, and 24 h, top to bottom) or its csrA mutant in the right panels (3, 10, and 24 h). OD600, optical density at 600 nm.
FIG. 2.
FIG. 2.
Laser confocal microscopy of biofilm produced by a csrA mutant. A topographical image of the biofilm formed by TR1-5MG1655 is shown in the left panel (white scale bar, 14 μm; virtual color code depicts biofilm height above the microscope slide, from 0 to 20 μm, in 2-μm increments), along with a 2-μm-thick cross-section at a depth of 6 μm in the right panel (scale bar, 10 μm) and a cross-section of a sagital view tilted (Q = 45°, F = 30°) in the bottom panel (scale bar, 20 μm), as visualized by confocal microscopy. Examples of apparent pillars (p) and channels (ch) are indicated.
FIG. 3.
FIG. 3.
Effects of csrA on 24-h biofilms grown in microtiter wells. (A) MG1655 (bars 1 to 3) or its csrA mutant (bars 4 to 6) containing plasmids pCSR10 (csrA) (bars 2 and 5) or pUC19 (bars 3 and 6). (B) Urinary tract pathogens E. coli P18 (bars 1 to 3) and C. freundii P5 (bars 4 to 6) containing plasmids pCSR10 (csrA) (bars 2 and 5) or pUC19 (bars 3 and 6). (C) Food-borne pathogens E. coli O157:H7 (bars 1 to 3) and S. enterica serovar Typhimurium ATCC 14028 (bars 4 to 6) containing plasmids pCSR10 (csrA) (bar 2), pSTCSR5 (S. enterica serovar Typhimurium csrA) (bar 5), or pUC19 (bars 3 and 6). Each bar shows the averages and standard errors of three separate experiments, and asterisks denote significant differences between strains (P < 0.0001).
FIG. 4.
FIG. 4.
Effects of extracellular and/or surface factors and global regulators on biofilm formation in E. coli strain MG1655 and its isogenic csrA mutant. Crystal violet staining of 24-h biofilms formed in microtiter wells by mutants disrupted in curli fimbriae, colanic acid, and/or type I pili (A); type I pili and/or motility (B); RpoS, curli fimbriae, and/or type I pili (C); or OmpR, curli fimbriae, and/or type I pili (D). Each bar shows the averages and standard errors of three separate experiments (P < 0.0001).
FIG. 5.
FIG. 5.
Effects of glycogen synthesis and catabolism on biofilm formation at 24 h. Isogenic derivatives of strain MG1655, defective for glgA, csrA, or both, were compared. Plasmids pOP245, pJF02, or pOP12 carry glgA, glgP, or asd-glgBXCAP′ (deleted for most of glgP), respectively. (A) Effects of a polar glgA mutation. The strain identities for bars 1 to 7 were MG1655, glgA mutant, glgA mutant containing pOP245, pJF02, or both plasmids, the csrA mutant, and the csrA glgA double mutant, respectively. (B) Overexpression of glycogen biosynthetic or catabolic genes. Lanes 1 to 5 show MG1655 containing either no plasmid, pOP12, pBR322 (vector control), pJF02, or pUC19 (vector control), respectively. Each bar shows the averages and standard errors of three separate experiments. The asterisks denote significant differences with respect to the parent strain (P < 0.0001).
FIG. 6.
FIG. 6.
Dispersal of bacteria from preformed biofilm by csrA induction. A strain containing an IPTG-inducible csrA gene, TRJM101[pCSRH6-19], was allowed to form a 24-h biofilm, whereafter IPTG (1 mM final concentration) or sterile water (containing ampicillin in each case) was added directly to the medium (A), the medium was discarded and fresh CFA containing ampicillin with or without IPTG was added (B), the medium was replaced with a M63 salts solution containing ampicillin with or without IPTG (C), or 0.2% glucose and ampicillin with or without IPTG was added directly to the spent media (D). Biofilm remaining at the indicated times following csrA induction is shown. Each value represents an average of at least two independent experiments, with quadruplicate samples, and asterisks denote significant differences between induced and uninduced cultures (P < 0.0001). (E) The medium at 24 h was replaced with M63 salts solution containing ampicillin with or without IPTG (as for panel C), and planktonic cells that were released were recovered without disturbing the biofilm, were serially diluted, and were plated onto Kornberg medium. Plating efficiency (CFU/milliliter) was determined from two separate experiments, each including 3 countable plates (>30 but <300 colonies) for each time point. Each of the data points depicts the averages and standard errors of the two experiments; asterisks denote significant differences between the induced and uninduced cultures (P < 0.0001).
FIG. 7.
FIG. 7.
Expression of a csrA-lacZ translational fusion in biofilm and planktonic cells of strain KSA712. Closed squares and open triangles represent determinations conducted on biofilm and planktonic cells, respectively. Average values (± standard errors), as determined from three cultures assayed with duplicate samples, are shown. Error bars are not visible where the standard error was less than the area occupied by a given symbol.

References

    1. Adams, J. L., and R. J. McLean. 1999. Impact of rpoS deletion on Escherichia coli biofilms. Appl. Environ. Microbiol. 65:4285–4287. - PMC - PubMed
    1. Allison, D. G., B. Ruiz, C. San Jose, A. Jaspe, and P. Gilbert. 1998. Extracellular products as mediators of the formation and detachment of Pseudomonas fluorescens biofilms. FEMS Microbiol. Lett. 167:179–184. - PubMed
    1. Allison, D. G., D. J. Evans, M. R. Brown, and P. Gilbert. 1990. Possible involvement of the division cycle in dispersal of Escherichia coli from biofilms. J. Bacteriol. 172:1667–1669. - PMC - PubMed
    1. Altier, C., M. Suyemoto, and S. D. Lawhon. 2000. Regulation of Salmonella enterica serovar Typhimurium invasion genes by csrA. Infect. Immun. 68:6790–6797. - PMC - PubMed
    1. Applegate, D. H., and J. D. Bryers. 1991. Effects of carbon and oxygen limitations and calcium concentrations on biofilm removal processes. Biotech. Bioeng. 37:17–25. - PubMed

Publication types

MeSH terms