. 2002 Jan 8;99(1):123-7.
doi: 10.1073/pnas.011589998. Epub 2001 Dec 11.

Receptor sensitivity in bacterial chemotaxis

Affiliations

Receptor sensitivity in bacterial chemotaxis

Victor Sourjik et al. Proc Natl Acad Sci U S A. .

Abstract

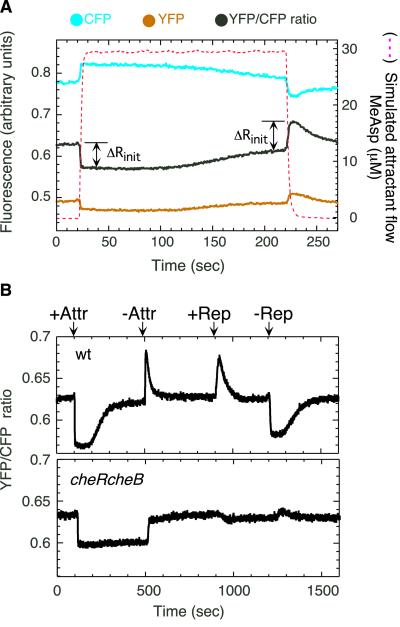
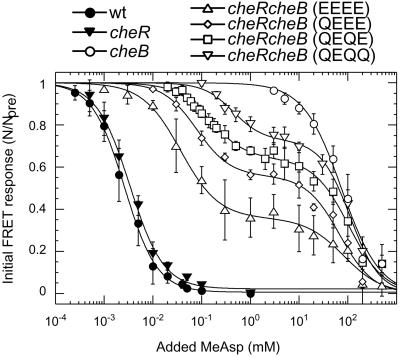
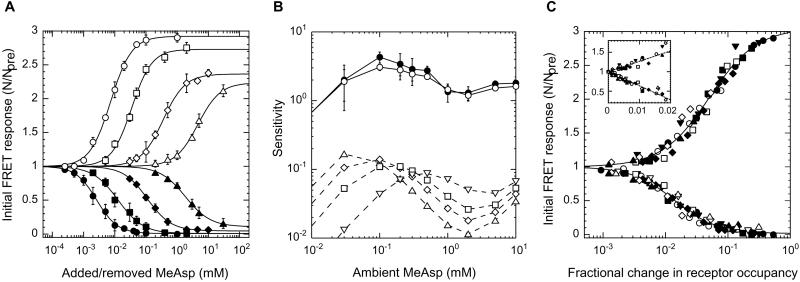
Chemoreceptors in Escherichia coli are coupled to the flagella by a labile phosphorylated intermediate, CheY approximately P. Its activity can be inferred from the rotational bias of flagellar motors, but motor response is stochastic and limited to a narrow physiological range. Here we use fluorescence resonance energy transfer to monitor interactions of CheY approximately P with its phosphatase, CheZ, that reveal changes in the activity of the receptor kinase, CheA, resulting from the addition of attractants or repellents. Analyses of cheR and/or cheB mutants, defective in receptor methylation/demethylation, show that response sensitivity depends on the activity of CheB and the level of receptor modification. In cheRcheB mutants, the concentration of attractant that generates a half-maximal response is equal to the dissociation constant of the receptor. In wild-type cells, it is 35 times smaller. This amplification, together with the ultrasensitivity of the flagellar motor, explains previous observations of high chemotactic gain.


Figures

Figure 1
Figure 1
Changes in protein–protein interactions observed by FRET upon chemotactic stimulation of cells of E. coli adsorbed to a coverslip. (A) Experimental scenario. Cells containing CheY/CheZ pairs were stimulated by stepwise addition or removal of attractant, MeAsp, as indicated by the dashed line (simulated by the flow of 0.5 μM fluorescein). Changes in protein–protein interactions result in changes in the ratio of fluorescence intensities of YFP and CFP. ΔRinit is the initial response to addition or removal of attractant. (B) FRET responses to addition/removal of attractant and to addition/removal of repellent for wild-type (wt) and mutant cells (cheRcheB) defective for methylation/demethylation. Stimulation levels were chosen to cause a near-saturating response. Attractant (Attr): 30 μM MeAsp for wt, 1.5 mM for cheRcheB. Repellent (Rep): 100 μM NiCl2.
Figure 2
Figure 2
Response of wild-type and cheR and/or cheB cells to steps of MeAsp at 0 ambient, measured with the CheY/CheZ FRET pair. Here, N/Npre is the number of FRET pairs after the stimulus divided by the number of FRET pairs before the stimulus, with N = 0 determined by the addition of a saturating amount of attractant and verified by acceptor bleaching. MeAsp was added and then removed in a sequence of steps of increasing size. Modification states of genetically engineered Tar receptors are noted in parentheses: E, glutamate, and Q, glutamine. For cheR the modification state should be all E, for cheRcheB with the native receptor QEQE (as shown), and for cheB either half glutamines and half methylated glutamates or all methylated glutamates. The smooth curves are fits to the data of a multisite Hill model; cheRcheB strains have two KD values, KD1 and KD2, with β the amplitude of the response corresponding to KD1 and (1 − β) the amplitude of the response corresponding to KD2. For the wild type, KD = 2.6 ± 0.5 μM; for cheR, KD = 3.3 ± 0.5 μM; for cheRcheB (EEEE), β = 0.65 ± 0.02, KD1 = 38 ± 5 μM, KD2 = 83 ± 17 mM; for cheRcheB (QEEE), β = 0.46 ± 0.02, KD1 = 80 ± 15 μM, KD2 = 77 ± 10 mM; for cheRcheB (QEQE), β = 0.36 ± 0.02, KD1 = 150 ± 15 μM, KD2 = 105 ± 19 mM; for cheRcheB (QEQQ), β = 0.27 ± 0.02, KD1 = 440 ± 70 μM, KD2 = 110 ± 10 mM; and for cheB, KD = 75 ± 18 mM. Hill coefficients were 1.2 ± 0.1. The absolute sizes of the response amplitudes generated by addition of saturating amounts of MeAsp varied among wild type, cheR, cheRcheB (EEEE), cheRcheB (QEEE), cheRcheB (QEQE), cheRcheB (QEQQ), and cheB strains in the ratios 1:0.06:1.3:1.5:1.6:1.8:1.9, respectively.
Figure 3
Figure 3
Response of wild-type cells to steps of MeAsp at different ambient concentrations, measured with the CheY/CheZ FRET pair. (A) Initial response amplitudes as a function of the magnitude of the step change in concentration of MeAsp after complete adaptation to ambient concentrations 0 (●), 0.1 (■), 0.5 (⧫), and 5 mM (▴). Additional MeAsp was added (closed symbols) and then removed (open symbols) in a sequence of steps of increasing size (as in Fig. 2). Hill coefficients were 1.2 ± 0.1. (B) Dependence of response sensitivity on changes in the concentration of MeAsp of 10% (●) or 20% (○), as a function of the ambient concentration (solid lines, Upper). Sensitivity is defined as the fractional change in FRET, (1 − N/Npre), divided by the fractional change in concentration. Also shown is the sensitivity calculated for cheRcheB cells with EEEE (▵), QEEE (◊), QEQE (□), or QEQQ (▿) receptors, using the fits to the response curves of Fig. 2 (dashed lines, Lower). (C) Data from experiments of the sort shown in A plotted as a function of fractional change in receptor occupancy. All the points shown represent measured values of N/Npre. The corresponding change in receptor occupancy was computed by using the fit to the response curve for the QEQE receptor, except at 0 ambient, where a 0.5:0.5 combination of EEEE and QEEE receptors was assumed. The smooth curves are fits to the pooled data of a multisite Hill model: for addition of attractant, apparent KD 0.014 ± 0.001, Hill coefficient 1.28 ± 0.05; for removal of attractant, apparent KD 0.050 ± 0.004, Hill coefficient 1.14 ± 0.06. (Inset) The same data for small changes in receptor occupancy, plotted on a linear scale. The smooth curves are linear fits (slopes −36 ± 1 and 27 ± 2, respectively). The different ambient concentrations were (in millimolar) 0 (●), 0.03 (▾), 0.1 (■), 0.2 (▿), 0.3 (□), 0.5 (⧫), 1 (○), 2 (◊), 5 (▴), and 10 (▵).

Comment in

References

    1. Berg H C, Brown D A. Nature (London) 1972;239:500–504. - PubMed
    1. Falke J J, Bass R B, Butler S L, Chervitz S A, Danielson M A. Annu Rev Cell Dev Biol. 1997;13:457–512. - PMC - PubMed
    1. Borkovich K A, Kaplan N, Hess J F, Simon M I. Proc Natl Acad Sci USA. 1989;86:1208–1212. - PMC - PubMed
    1. Welch M, Oosawa K, Aizawa S-I, Eisenbach M. Proc Natl Acad Sci USA. 1993;90:8787–8791. - PMC - PubMed
    1. Alon U, Camarena L, Surette M G, Aguera y Arcas B, Liu Y, Leibler S, Stock J B. EMBO J. 1998;17:4238–4248. - PMC - PubMed

Publication types