

Building highly sensitive dye assemblies for biosensing from molecular building blocks
- PMID: 11742082
- PMCID: PMC64933
- DOI: 10.1073/pnas.251555298
Building highly sensitive dye assemblies for biosensing from molecular building blocks
Abstract
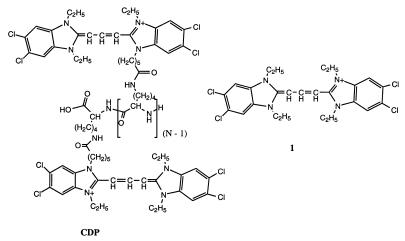
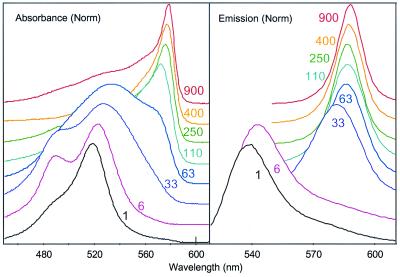
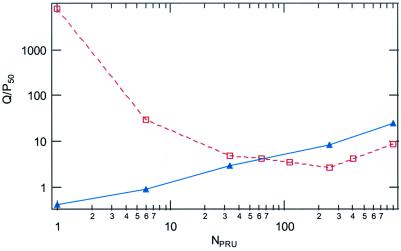
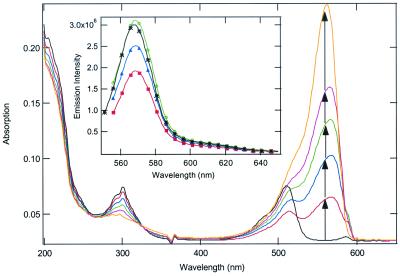
Fluorescence superquenching is investigated for polyelectrolytes consisting of cyanine dye pendant polylysines ranging in number of polymer repeat units (N(PRU)) from 1 to 900, both in solution and after adsorption onto silica nanoparticles. As N(PRU) increases, the absorption and fluorescence evolve from monomer spectra to red-shifted features indicative of molecular J aggregates. In solution, the superquenching sensitivity toward an anionic electron acceptor increases by more than a millionfold over the N(PRU) range from 1 to 900. The dramatic increase is attributed to enhanced equilibrium constants for binding the quenchers, and the amplified quenching of a delocalized exciton of approximately 100 polymer repeat units. The self-assembly of monomer onto silica and clay nanoparticles leads to formation of J aggregates, and surface-activated superquenching enhanced 10,000x over the monomer in solution, indicating the formation of "self-assembled polymers" on the nanoparticle surface. Utilization of these self-assembled polymers as high-sensitivity biosensors is demonstrated.
Figures

Comment on
-
Structure of a quinohemoprotein amine dehydrogenase with an uncommon redox cofactor and highly unusual crosslinking.Proc Natl Acad Sci U S A. 2001 Dec 4;98(25):14268-73. doi: 10.1073/pnas.241429098. Epub 2001 Nov 20. Proc Natl Acad Sci U S A. 2001. PMID: 11717396 Free PMC article.
References
-
- Chen L, McBranch D, Wang R, Whitten D. Chem Phys Lett. 2000;330:27–33.
-
- Chen L, Xu S, McBranch D, Whitten D. J Am Chem Soc. 2000;122:9302–9303.
-
- Wang J, Wang D, Miller E K, Moses D, Bazan G C, Heeger A J. Macromolecules. 2000;33:5153–5158.
-
- Harrison B S, Ramey M B, Reynolds J R, Schanze K S. J Am Chem Soc. 2000;122:8561–8562.
Publication types
MeSH terms
Substances
LinkOut - more resources
Full Text Sources
Other Literature Sources
Research Materials
