. 2001 Dec 18;98(26):15354-9.
doi: 10.1073/pnas.261253998. Epub 2001 Dec 11.

Alkalinization by chloride/bicarbonate pathway in larval mosquito midgut

Affiliations

Alkalinization by chloride/bicarbonate pathway in larval mosquito midgut

D Y Boudko et al. Proc Natl Acad Sci U S A. .

Abstract

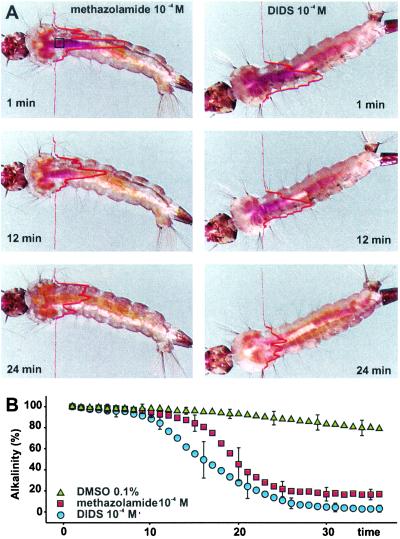
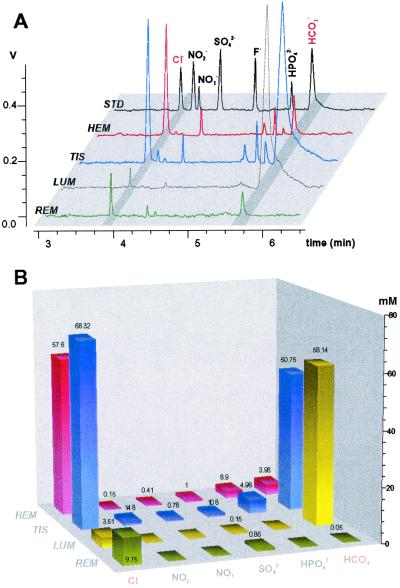
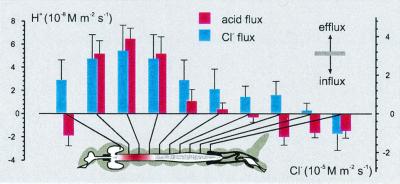
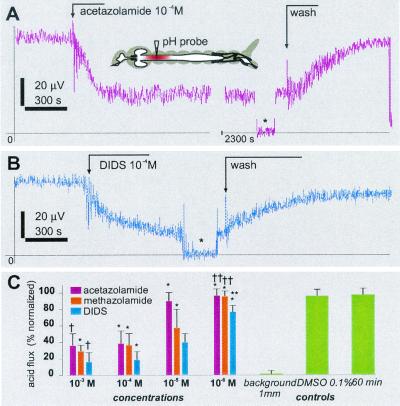
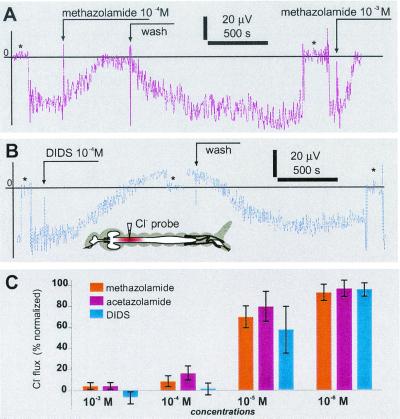
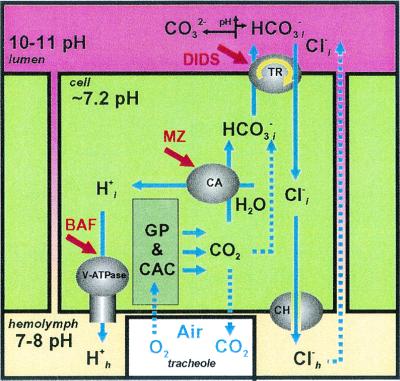
The midgut of mosquito larvae maintains a specific lumen alkalinization profile with large longitudinal gradients (pH approximately 3 units*mm(-1)) in which an extremely alkaline (pH approximately 11) anterior midgut lies between near-neutral posterior midgut and gastric cecum (pH 7-8). A plasma membrane H(+) V-ATPase energizes this alkalinization but the ion carriers involved are unknown. Capillary zone electrophoresis of body samples with outlet conductivity detection showed a specific transepithelial distribution of chloride and bicarbonate/carbonate ions, with high concentrations of both anions in the midgut tissue: 68.3 +/- 5.64 and 50.8 +/- 4.21 mM, respectively. Chloride was higher in the hemolymph, 57.6 +/- 7.84, than in the lumen, 3.51 +/- 2.58, whereas bicarbonate was higher in the lumen, 58.1 +/- 7.34, than the hemolymph, 3.96 +/- 2.89. Time-lapse video assays of pH profiles in vivo revealed that ingestion of the carbonic anhydrase inhibitor acetazolamide and the ion exchange inhibitor DIDS (4,4'-diisothiocyanatostilbene-2,2'-disulfonic acid), at 10(-4) M eliminates lumen alkalinization. Basal application of these inhibitors in situ also reduced gradients recorded with self-referencing pH-sensitive microelectrodes near the basal membrane by approximately 65% and 85% respectively. Self-referencing chloride-selective microelectrodes revealed a specific spatial profile of transepithelial chloride transport with an efflux maximum in anterior midgut. Both acetazolamide and DIDS reduced chloride effluxes. These data suggest that an H(+) V-ATPase-energized anion exchange occurs across the apical membrane of the epithelial cells and implicate an electrophoretic Cl(-)/HCO(3)(-) exchanger and carbonic anhydrase as crucial components of the steady-state alkalinization in anterior midgut of mosquito larvae.


Figures

Figure 1
Figure 1
Time-lapse monitoring of alkalinity profile in intact larvae. (A) Images extracted from time-lapse video recordings of fourth-instar A. aegypti. Dye intensity in the presence of 10−4 M methazolamide (Right) or in the presence of 10−4 M DIDS (Left). The lines through the images represent the relative optical density profile on a magenta channel (NIH image). The dark purple staining in anterior midgut in the 1-min frame corresponds to a pH value above 10. By 24 min, the pH has declined and approaches 7. The pH values in the referenced points were confirmed with pH-sensitive glass microelectrodes (11.1 ± 0.2). (B) Time course of midgut dealkalinization after addition of methazolamide and DIDS. Error bars represent SD value of every fifth time-lapse sample (n ≥ 4).
Figure 2
Figure 2
CZE analyses of anions in mosquito body samples with outlet conductivity detector. (A) Orthogonal overlay of typical electropherograms from subset of biological samples. REM, rearing media; LUM, ectoperitrophic fluid (lumen) sample from the anterior midgut area; TIS, anterior midgut tissue sample; HEM, hemolymph; STD, 2-ppm mixture of anion standards. z axis signal from conductivity detector, V (scale setting of 1 V corresponds to 100 μS). (B) The absolute values of ion concentrations were estimated by using peak areas and slope values from standard solutions. The z axis is the estimated ion concentrations in undiluted samples in mM. Numbers above bars are mean values of the determined concentrations (n ≥ 3, for all values shown).
Figure 3
Figure 3
Regional specificity of transepithelial chloride and acid fluxes in midgut of fourth-instar A. aegypti. (Inset) SERIS-LIX probe positions for each bar of the histogram. Bars are flux values calculated from Eqs. 3 and 4 (J ± SD).
Figure 4
Figure 4
Pharmacological effects of acetazolamide, methazolamide, and DIDS on acid efflux in the anterior midgut of mosquito larvae. (A and B) Time course of SERIS-pH-LIX probe readings during basal application of acetazolamide (A) and DIDS (B). Broken arrows indicate events during recording. *, A background signal at 1 mm from the tissue. (Inset) The approximate position of the recording probe. (C) Normalized dose–response histogram of acid efflux inhibition. Bars are mean ± SD (n ≥ 4 for each concentration). *, A significant difference of the value compared with a value from the preceding 1:10 dilution (paired t test, P > 0.001 for all significant definitions); †, insignificant differences of the value compared with the value from the preceding 1:10 dilution; **, significant differences compared with 0.1% DMSO and 30-min controls; ††, insignificant difference compared with the controls.
Figure 5
Figure 5
Pharmacological effects of methazolamide and DIDS on chloride effluxes in the anterior midgut of mosquito larvae. (A and B) Time course of SERIS-Cl-LIX probe readings during basal application of methazolamide (A) and DIDS (B). Broken arrows indicate events during recording. Asterisks indicate a background signal at 1 mm from the tissue. (C) Normalized dose–response histogram of Cl efflux inhibition. Bars are mean ± SD (n ≥ 4 for each concentration).
Figure 6
Figure 6
Diagram of hypothetical midgut alkalinization (see Discussion). The deduced locations of the membrane-energizing H+ V-ATPase, the proton- and bicarbonate-supplying CA, and the putative voltage-driven Cl/HCOformula image anion exchanger are shown. The most effective inhibitors of the pathway are bafilomycin A (BAF), methazolamide (MZ), and DIDS. GP, glycolytic pathway; CAC, citric acid cycle.

References

    1. Dadd R H. J Insect Physiol. 1975;21:1847–1853. - PubMed
    1. Berenbaum M. Am Nat. 1980;115:138–146.
    1. Martin M M, Martin J C, Kukor J J, Merit R W. Oecologia. 1980;46:360–364. - PubMed
    1. Stiles B, Paschke J D. J Invert Pathol. 1980;35:58–64.
    1. Filippova M, Ross L S, Gill S S. Insect Mol Biol. 1998;7:223–232. - PubMed

Publication types