. 2001 Dec 17;20(24):7149-59.
doi: 10.1093/emboj/20.24.7149.

Flipping a genetic switch by subunit exchange

Affiliations

Flipping a genetic switch by subunit exchange

L J Lambert et al. EMBO J. .

Erratum in

  • EMBO J. 2004 Aug 4;23(15):3186

Abstract

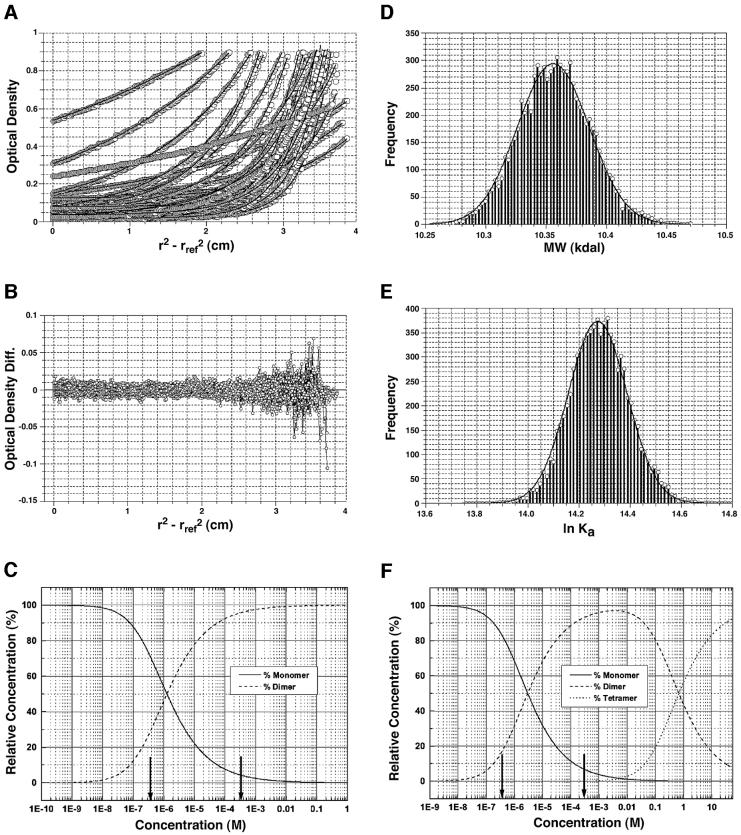
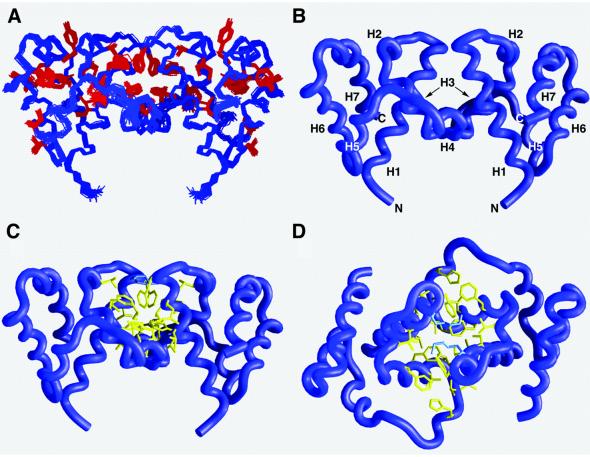
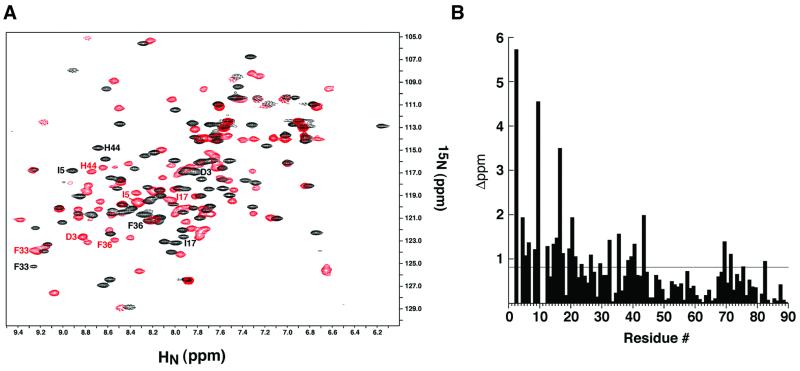
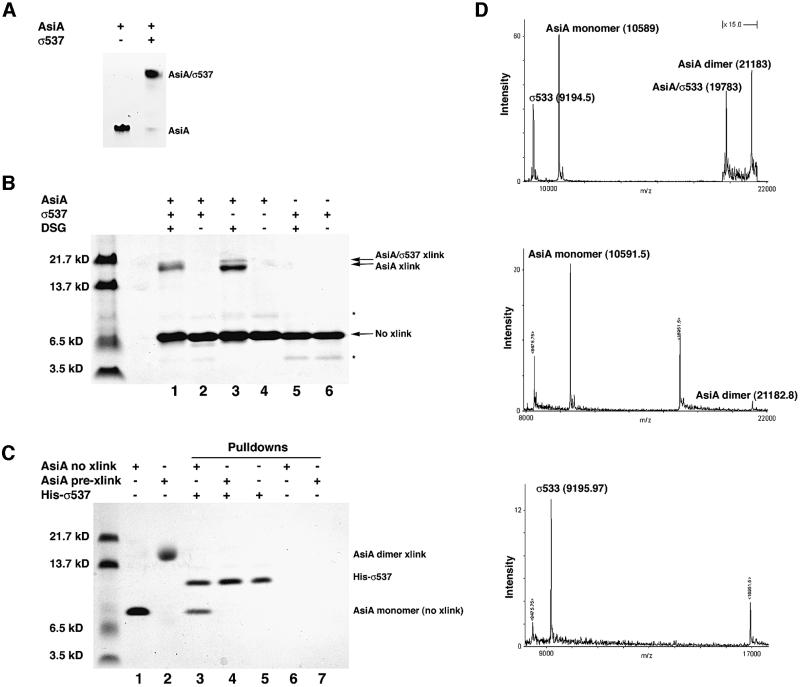
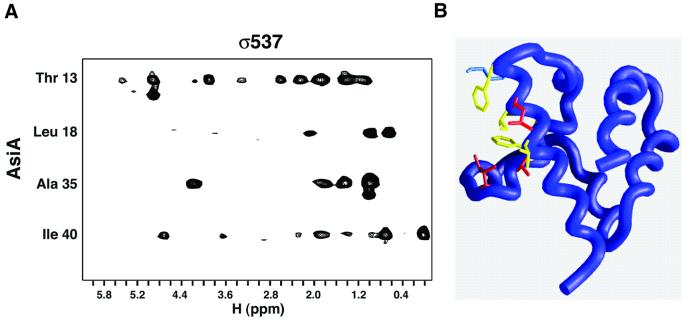
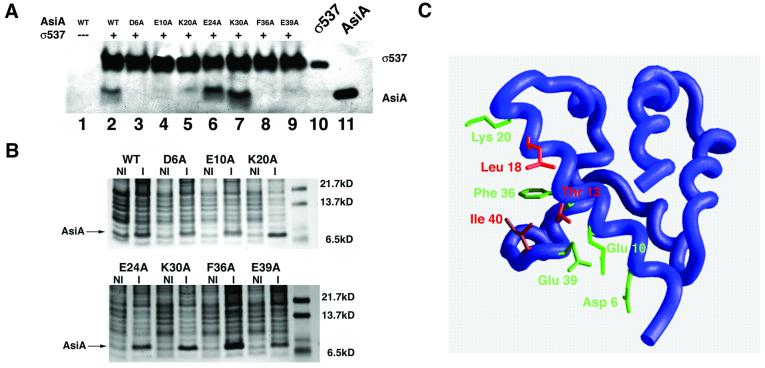
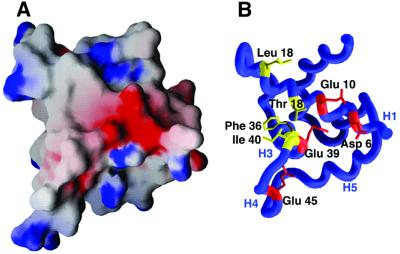
The bacteriophage T4 AsiA protein is a multifunctional protein that simultaneously acts as both a repressor and activator of gene expression during the phage life cycle. These dual roles with opposing transcriptional consequences are achieved by modification of the host RNA polymerase in which AsiA binds to conserved region 4 (SR4) of sigma(70), altering the pathway of promoter selection by the holoenzyme. The mechanism by which AsiA flips this genetic switch has now been revealed, in part, from the three-dimensional structure of AsiA and the elucidation of its interaction with SR4. The structure of AsiA is that of a novel homodimer in which each monomer is constructed as a seven-helix bundle arranged in four overlapping helix-loop-helix elements. Identification of the protein interfaces for both the AsiA homodimer and the AsiA-sigma(70) complex reveals that these interfaces are coincident. Thus, the AsiA interaction with sigma(70) necessitates that the AsiA homodimer dissociate to form an AsiA-SR4 heterodimer, exchanging one protein subunit for another to alter promoter choice by RNA polymerase.


Figures

None
Fig. 1. Sedimentation equilibrium analysis of the AsiA dimer. (A) Overlay of 38 wavelength scans and (B) residuals from the global fit of the data as described in Materials and methods. The Monte Carlo distribution of the molecular weight (D) and the association constant (E) (ln Ka) are shown which establish an experimental Mr = 10.36 ± 0.077 kDa for the monomer and an association constant of 1.58 ± 0.404 × 106/M. The equilibrium distribution plots for monomer–dimer (C) and monomer–dimer–tetramer (F) fits reveal that very little tetramer was present at the concentrations at which these measurements were taken (indicated by vertical arrows) and result in low confidence in the monomer–tetramer association constant.
None
Fig. 2. Three-dimensional structure of the AsiA dimer. (A) The superposition of the 29 structures is shown for the non-hydrogen backbone atoms in blue and selected side chains in red. The coordinate precision for the structure family was 0.35 Å r.m.s.d. from the mean for the backbone atoms and 0.86 Å r.m.s.d from the mean for all non-hydrogen atoms. (B) Identical view of the AsiA dimer representing the backbone of the protein as a blue worm. The relative orientation of the helices in each monomer is indicated and illustrates the overlapping helix–loop–helix elements. HLH1 = α-helix H1 (Asn4–Lys20), loop L1 (Phe21–Thr23) and α-helix H2 (Glu24–Glu28). HLH2 = α-helix H3 (Arg30–Gly41) and 310 helix H4 (residues Thr43–Arg47). HLH3 = α-helix H5 (Gln51–Ser59), loop L2 (Glu60–Thr62) and α-helix H6 (Gln63–Glu72). HLH4 = α-helix H6 (Gln63–Glu72) and α-helix H7 (Asn74–Met86). (C and D) Two views of the AsiA dimer interface. In (C), the view is identical to (A) and (B). In (D), the view is rotated 90° about the horizontal axis. Non-polar amino acids are shown in yellow (Thr13, Val14, Ile17, Leu18 and Phe21 of helix H1, Phe33, Phe36, Leu37 and Ile40 of helix H3, and His44), and positively charged amino acids in blue (Lys20).
None
Fig. 3. Analysis of the σ537-binding surface by NMR ‘footprinting’. (A) AsiA homodimer (black) and the AsiA–σ537 complex (red) were analyzed by 15N–1H HSQC spectroscopy with 15N-labeled AsiA and unlabeled σ537. The positions of several residues that move substantially upon addition of σ537 are shown in black for the AsiA homodimer and in red for the AsiA–σ537 complex. (B) A histogram of the composite chemical shift changes (see Materials and methods) defines a broad ‘footprint’ (>0.8 p.p.m. change) of σ537 on AsiA that encompasses many of residues 3–20 and residues 33, 36, 39–40 and 44. These residues reside along the homodimer interface of AsiA.
None
Fig. 4. AsiA forms a 1:1 complex with SR4. (A) Non-denaturing Tris-alanine PhastGel (Amersham/Pharmacia) at pH 8.8 demonstrating the homogeneity of the AsiA homodimer and AsiA–σ537 complex preparations used for protein cross-linking with DSG. σ537 fails to run into this gel matrix. (B) Denaturing SDS-tricine PAGE of homodimers and AsiA–σ537 complexes following cross-linking with DSG. σ537 fails to form a cross-link with DSG (lanes 5 and 6), in contrast to the AsiA homodimer (lanes 3 and 4) and the AsiA–σ537 complex (lanes 1 and 2). Cross-linking with the AsiA homodimer produces a major and minor species (lane 3), while cross-linking the heterodimer produces a single species of slightly different mobility with apparently the same size as the cross-linked AsiA homodimer. Note that non-denaturing PAGE (A) establishes that the cross-linked species in each case are either pure homodimer (lane 3) or pure complex (lane 1). (C) Pre-cross-linked AsiA does not bind σ537 in an affinity tag pull-down experiment. Solutions of purified AsiA (lane 1) or purified AsiA cross-linked with DSG (lane 2) were probed with N-terminal His6-tagged σ537 immobilized on Ni2+-Sepharose. While uncross-linked AsiA was pulled down by His-σ537 (lane 3), pre-cross-linked AsiA was no longer capable of binding His-σ537 (lane 4). This indicates that an AsiA dimer which cannot dissociate is unable to bind σ537 in solution. Lanes 6 and 7 indicate that neither uncross-linked AsiA (lane 6) nor pre-cross-linked AsiA (lane 7) bind to Ni2+-Sepharose on their own. (D) MALDI of AsiA, σ533 and AsiA–σ533 complexes (see Materials and methods for details). The mass spectra of the AsiA homodimer and σ533 are shown alone in the middle and bottom panels, respectively. The peaks bracketing the main peak are those of the myoglobin calibrant with the +1 ion at 16 951.5 and the +2 ion at 8475.75. The top panel shows the mass spectrum of the AsiA–σ533 mixture with AsiA homodimer. In this spectrum, the masses of both protein complexes are seen, along with each of the monomer species from which they are derived. This demonstrates that the mass of the AsiA–σ533 complex is that of a 1:1 complex with complete subunit dissociation from homodimer to heterodimer.
None
Fig. 5. The homodimer and heterodimer interfaces of AsiA are coincident. (A) The AsiA–σ537 complex was labeled asymmetrically with 13C/15N incorporation into AsiA and no labeling in σ537. A partial map of the AsiA–σ537 interface was visualized by F1-filtered/F3-edited 13C-NOESY (Zwahlen et al., 1997) and AsiA residues at the interface assigned by standard techniques. (B) The identified residues at the AsiA–σ537 interface are mapped onto the AsiA monomer, which represents the right monomer in Figure 2B. Residues at the homodimer interface are shown in yellow and blue as described in Figure 2C; residues that participate in both the homo- and heterodimer interfaces are shown in red. Ala35 is obscured in this view and cannot be seen.
None
Fig. 6. Mutagenesis of the AsiA homodimer interface. (A) The indicated mutant proteins (lanes 2–9) were analyzed for their ability to bind σ537 immobilized on chelating Sepharose 4B. Lane 1 represents a pull-down assay with beads alone (i.e. Ni2+ beads lacking σ537). Lane 10 represents purified σ537 that has not been exposed to AsiA. Lane 11 is purified wild-type AsiA that has not been exposed to σ537. Alanine substitution of charged residues that reside at the AsiA homodimer interface (Asp6, Glu10 and Glu39) results in mutant proteins that fail to bind σ537. Alanine substitutions at two other residues, Glu24 and Lys30, retain the ability to bind AsiA in this assay. (B) Expression of wild-type and mutant AsiAs. Uninduced (NI) and induced (I) expression of wild-type and mutant AsiAs visualized by Coomassie Blue staining. The position of the induced band representing the wild-type or mutant proteins is indicated. (C) Mapping of the heterodimer interface onto the AsiA monomer structure. Red residues (Thr13, Leu18, Ala35 and Ile40) display intermolecular NOEs to SR4 in an AsiA–σ537 complex. Green residues (Asp6, Glu10, Lys20, Phe36 and Glu39) fail to bind SR4 in a pull-down assay when mutated to alanine. Ala35 is obscured in this view and cannot be seen.
None
Fig. 7. Characteristics of the SR4-binding surface of AsiA. (A) Electrostatic potential map (drawn at ±9 kT) of the AsiA monomer viewed from the homodimer interface (Nicholls et al., 1991). Negatively charged surfaces are shown in red and positively charged surfaces in blue. (B) The negative patch seen in the center of the electrostatic surface is created by a collection of acidic residues (Asp6, Glu10, Glu39 and Glu45). These residues are hypothesized to be at least partially buried at the AsiA–SR4 interface. Hydrophobic amino acids which also make up part of the SR4 binding surface are shown in yellow.

References

    1. Adelman K., Orsini,G., Kolb,A., Graziani,L. and Brody,E.N. (1997) The interaction between the AsiA protein of bacteriophage T4 and the σ70 subunit of Escherichia coli RNA polymerase. J. Biol. Chem., 272, 27435–27443. - PubMed
    1. Brünger A.T. (1992) X-PLOR Manual, Version 3.1. Yale University Press, New Haven, CT.
    1. Bushman F.D., Shang,C. and Ptashne,M. (1989) A single glutamic acid residue plays a key role in the transcriptional activation function of λ repressor. Cell, 58, 1163–1171. - PubMed
    1. Cadene M. and Chait,B.T. (2000) A robust, detergent-friendly method for mass spectrometric analysis of integral membrane proteins. Anal. Chem., 72, 5655–5658. - PubMed
    1. Campbell E.A. and Darst,S.A. (2000) The anti-σ factor SpoIIAB forms a 2:1 complex with σF, contacting multiple conserved regions of the σ factor. J. Mol. Biol., 300, 17–28. - PubMed

Publication types

Substances

Associated data