. 2001 Dec;127(4):1607-16.
doi: 10.1104/pp.010467.

Circadian clock-regulated expression of phytochrome and cryptochrome genes in Arabidopsis

Affiliations

Circadian clock-regulated expression of phytochrome and cryptochrome genes in Arabidopsis

R Tóth et al. Plant Physiol. 2001 Dec.

Abstract

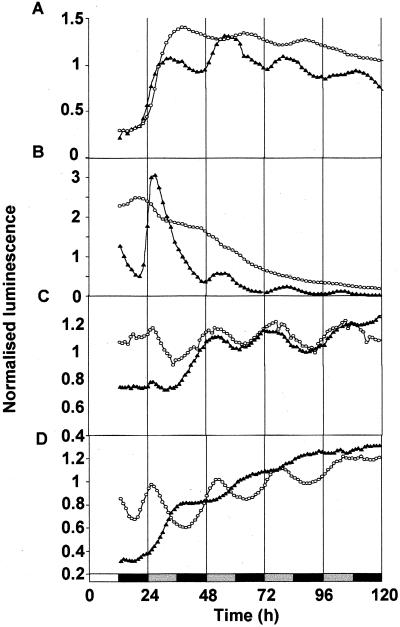
Many physiological and biochemical processes in plants exhibit endogenous rhythms with a period of about 24 h. Endogenous oscillators called circadian clocks regulate these rhythms. The circadian clocks are synchronized to the periodic environmental changes (e.g. day/night cycles) by specific stimuli; among these, the most important is the light. Photoreceptors, phytochromes, and cryptochromes are involved in setting the clock by transducing the light signal to the central oscillator. In this work, we analyzed the spatial, temporal, and long-term light-regulated expression patterns of the Arabidopsis phytochrome (PHYA to PHYE) and cryptochrome (CRY1 and CRY2) promoters fused to the luciferase (LUC(+)) reporter gene. The results revealed new details of the tissue-specific expression and light regulation of the PHYC and CRY1 and 2 promoters. More importantly, the data obtained demonstrate that the activities of the promoter::LUC(+) constructs, with the exception of PHYC::LUC(+), display circadian oscillations under constant conditions. In addition, it is shown by measuring the mRNA abundance of PHY and CRY genes under constant light conditions that the circadian control is also maintained at the level of mRNA accumulation. These observations indicate that the plant circadian clock controls the expression of these photoreceptors, revealing the formation of a new regulatory loop that could modulate gating and resetting of the circadian clock.


Figures

Figure 1
Figure 1
Tissue-specific expression of the various luminescent reporter constructs in Arabidopsis seedlings. Plants were grown under 12-h-light (60–70 μm m−2 s−1, white fluorescent)/12-h-dark photoperiods for 7 d. Images were taken during the light phase (between 4 and 8 h after the lights were on) on the 8th d after germination. Pictures are arranged as pairs of corresponding images. Right, Reflected-light image; left, false-colored luminescence image of the same seedling carrying the given transgene. A, CAB2::LUC+; B, PHYA::LUC+; C, PHYB:LUC+; D, PHYC::LUC+; E, PHYD::LUC+; F, PHYE::LUC+; G, CRY1::LUC+; H, CRY2::LUC+. The false-color scale goes from blue (low activity) to red and white (high activity).
Figure 2
Figure 2
Diurnal regulation of phytochrome and cryptochrome gene expression in Arabidopsis seedlings. Seedlings were grown under 12-h-light/12-h-dark cycles for 1 week, and were then imaged under the same conditions. A, PHYA::LUC+ (○), PHYB::LUC+ (▴); B, PHYC::LUC+ (○), CAB2::LUC+ (▴); C, PHYD::LUC+ (○), PHYE::LUC+ (▴); D, CRY1::LUC+ (○), CRY2::LUC+ (▴). White box on time axis, Light interval; black box, dark interval.
Figure 3
Figure 3
Circadian regulation of phytochrome and cryptochrome gene expression in LL. Seedlings were grown and entrained as in Figure 2, but were imaged after transfer to LL. A, PHYA::LUC+ (○), PHYB::LUC+ (▴); B, PHYC::LUC+ (○), CAB2::LUC+ (▴); C, PHYD::LUC+ (○), PHYE::LUC+ (▴); D, CRY1::LUC+ (○), CRY2::LUC+ (▴). White box on time axis, Light interval; striped box, subjective dark interval.
Figure 4
Figure 4
Circadian regulation of phytochrome and cryptochrome gene expression in DD. Seedlings were grown and entrained as in Figure 2 and 3, but were imaged after transfer to DD. A, PHYA::LUC+ (○), PHYB::LUC+ (▴); B, PHYC::LUC+ (○), CAB2::LUC+ (▴); C, PHYD::LUC+ (○), PHYE::LUC+ (▴); D, CRY1::LUC+ (○), CRY2::LUC+ (▴). White box on time axis, Light interval; black box, dark interval; gray box, subjective light intervals.
Figure 5
Figure 5
Mean expression levels of the various reporter constructs in 1-week-old Arabidopsis seedlings under extended LL (white columns) or DD (black columns) conditions. Seedlings were grown and entrained as in Figure 2, and were then transferred to LL or DD conditions. Luminescence was measured in 1- to 2-h intervals for 4 d (starting from ZT 24) in a TopCount luminometer. The experiment included 24 individual seedlings from each of three to four independent transgenic lines for each reporter construct. The average of counts collected during the entire measurement from seedlings carrying the same transgene was calculated and is presented in Figure 5 as the mean expression level of that construct under the conditions specified. To accommodate the large differences in expression level between the constructs, the y axis was drawn with two different scales. Note that luminescence activities presented on this figure were not calculated from graph data presented in Figures 3 and 4.
Figure 6
Figure 6
Circadian accumulation of phytochrome and cryptochrome mRNA in LL. Wild-type Arabidopsis seedlings (WS ecotype) were grown under LD cycles for 1 week, and were then transferred to LL. Abundance of the phytochrome- and cryptochrome-specific mRNAs was measured in samples harvested in 4-h intervals by RNase protection assays using 30 μg of total RNA per lane. For CAB2 mRNA determination, 15 μg of total RNA was analyzed by northern blots hybridized with the coding region of the CAB2 gene (B). The measurement of the UBQ10 mRNA abundance was included in all experiments as an internal control. The radioactive signals of the protected fragments were quantified by PhosphorImager and normalized to the corresponding UBQ10 signals, and then to the highest value of the normalized test gene signals. Because the experiments were highly reproducible, only one set of the autoradiograms is shown for each gene. White box on time axis, Light interval; gray box, subjective dark interval.
Figure 7
Figure 7
A circle diagram illustrating the relative phases of peak activity of the various reporter constructs as determined in the measurements under LL (see Fig. 2). The time of the day is presented as the face of a 24-h clock. ZT 0 to ZT 12, Light interval; ZT 12 to ZT 24, subjective dark interval. Genes with similar timing of peak expression are grouped and boxed. Arrows point to the specific time of the peak activity of the individual groups.
Figure 8
Figure 8
A working model of the plant circadian system incorporating the regulatory loop from the output to the input photoreceptors.

Similar articles

Cited by

References

    1. Adam E, Kozma-Bognár L, Kolar C, Schäfer E, Nagy F. The tissue-specific expression of tobacco phytochrome B gene. Plant Physiol. 1996;110:1081–1088. - PMC - PubMed
    1. Adam E, Szell M, Szekeres M, Schäfer E, Nagy F. The developmental and tissue-specific expression of tobacco phytochrome A genes. Plant J. 1994;6:283–293.
    1. Ahmad M, Cashmore AR. HY4 gene of A. thaliana encodes a protein with characteristics of blue-light photoreceptor. Nature. 1993;366:162–166. - PubMed
    1. Carré IA, Kay SA. Multiple DNA-protein complexes at a circadian-regulated promoter element. Plant Cell. 1995;7:2039–2051. - PMC - PubMed
    1. Casal JJ, Cerdan PD, Staneloni RJ, Cattaneo L. Different phototransduction kinetics of phytochrome A and phytochrome B in Arabidopsis thaliana. Plant Physiol. 1998;116:1533–1538. - PMC - PubMed

Publication types

MeSH terms