. 2001 Dec 15;537(Pt 3):763-78.
doi: 10.1111/j.1469-7793.2001.00763.x.

Regulation of the calcium release channel from rabbit skeletal muscle by the nucleotides ATP, AMP, IMP and adenosine

Affiliations

Regulation of the calcium release channel from rabbit skeletal muscle by the nucleotides ATP, AMP, IMP and adenosine

D R Laver et al. J Physiol. .

Abstract

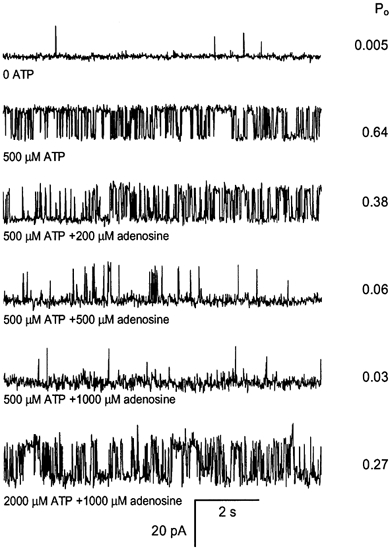
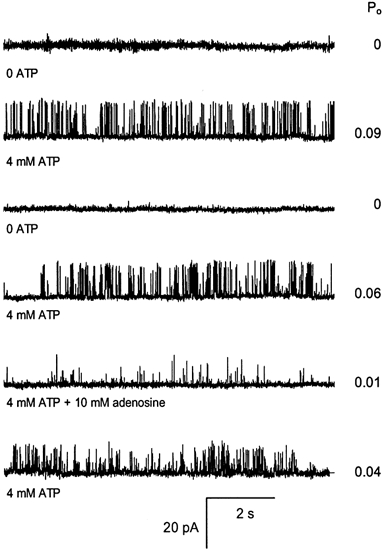
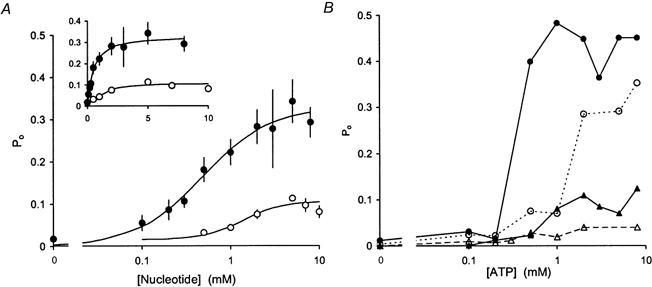
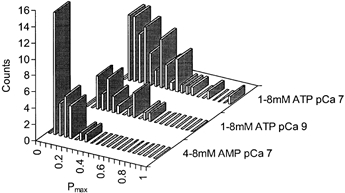
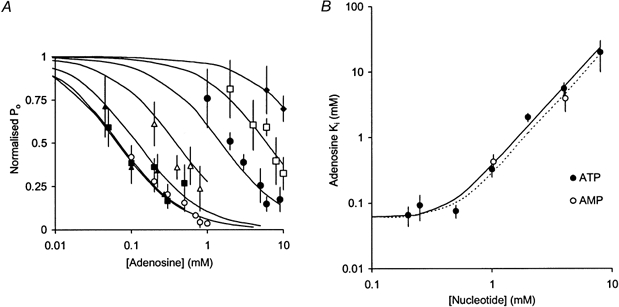
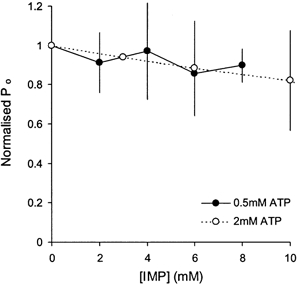
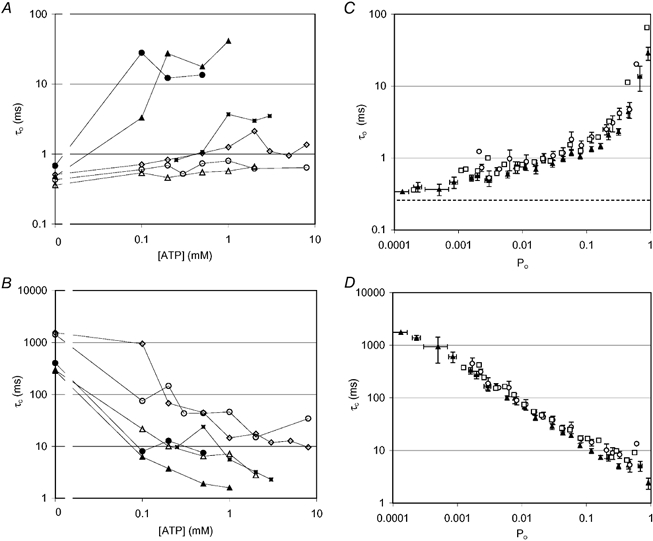
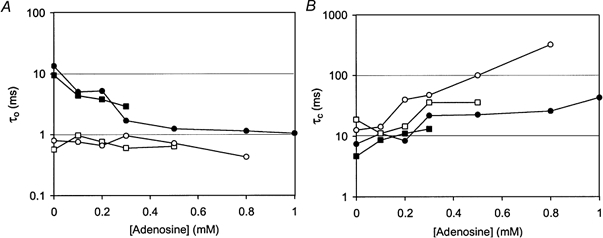
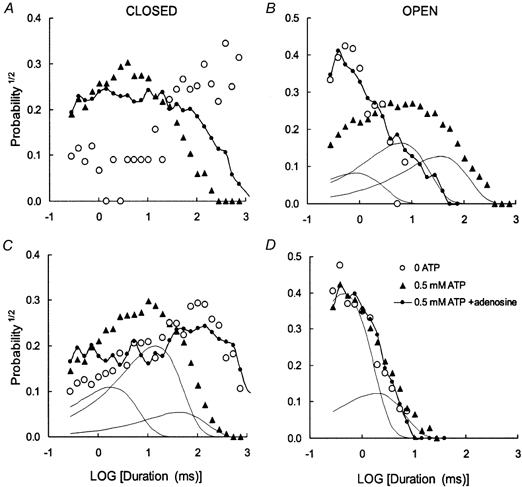
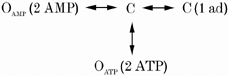
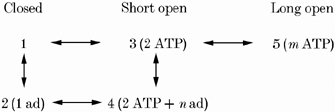
1. Nucleotide activation of skeletal muscle ryanodine receptors (RyRs) was studied in planar lipid bilayers in order to understand RyR regulation in vivo under normal and fatigued conditions. With 'resting' calcium (100 nM cytoplasmic and 1 mM luminal), RyRs had an open probability (P(o)) of approximately 0.01 in the absence of nucleotides and magnesium. ATP reversibly activated RyRs with P(o) at saturation (P(max)) approximately 0.33 and K(a) (concentration for half-maximal activation) approximately 0.36 mM and with a Hill coefficient (n(H)) of approximately 1.8 in RyRs when P(max) < 0.5 and approximately 4 when P(max) > 0.5. 2. AMP was a much weaker agonist (P(max) approximately 0.09) and adenosine was weaker still (P(max) approximately 0.01-0.02), whereas inosine monophosphate (IMP), the normal metabolic end product of ATP hydrolysis, produced no activation at all. 3. Adenosine acted as a competitive antagonist that reversibly inhibited ATP- and AMP-activated RyRs with n(H) approximately 1 and K(i) approximately 0.06 mM at [ATP] < 0.5 mM, increasing 4-fold for each 2-fold increase in [ATP] above 0.5 mM. This is explained by the binding of a single adenosine preventing the cooperative binding of two ATP or AMP molecules, with dissociation constants of 0.4, 0.45 and 0.06 mM for ATP, AMP and adenosine, respectively. Importantly, IMP (< or = 8 mM) had no inhibitory effect whatsoever on ATP-activated RyRs. 4. Mean open (tau(o)) and closed (tau(c)) dwell-times were more closely related to P(o) than to the nucleotide species or individual RyRs. At P(o) < 0.2, RyR regulation occurred via changes in tau(c), whereas at higher P(o) this also occurred via changes in tau(o). The detailed properties of activation and competitive inhibition indicated complex channel behaviour that could be explained in terms of a model involving interactions between different subunits of the RyR homotetramer. 5. The results also show how deleterious adenosine accumulation is to the function of RyRs in skeletal muscle and, by comparison with voltage sensor-controlled Ca(2+) release, indicate that voltage sensor activation requires ATP binding to the RyR to be effective.


Figures

Figure 1
Figure 1. Representative segments of an experiment showing the competitive effects of ATP and adenosine on a single skeletal RyR
The cis (cytoplasmic) solution contained 250 mm Cs+ (230 mm CsCH3O3S, 20 mm CsCl) with 100 nm Ca2+ (4.5 mm BAPTA, 1 mm Ca2+) and various concentrations of ATP and adenosine at pH 7. 4. The trans (luminal) solution contained 50 mm Cs+ (30 mm CsCH3O3S, 20 mm CsCl), 1 mm CaCl2 at pH 7. 4. All solutions were pH buffered with 10 mm Tes. The membrane potential was held at +40 mV and channel openings are shown here by upward deflections of the current from the baseline. The RyR open probability (Po) determined from > 30 s recordings is shown at the right of each trace. Top trace, RyRs were relatively inactive in 100 nm Ca2+ in the absence of ATP. Second trace, addition of 500 μm ATP to the cis bath (aliquot addition) markedly activated the channel. Traces 3-5, subsequent addition of adenosine reduced channel activity. Bottom trace, subsequently increasing [ATP] to 2000 μm reversed the inhibitory effect of 1000 μm adenosine.
Figure 2
Figure 2. Reversibility of ATP activation and adenosine inhibition of RyRs
The experimental conditions are given in the legend to Fig. 1 and the nucleotide concentrations are given at the left of each trace. The Po, determined from > 30 s recordings, is shown at the right of each trace. Top trace, RyRs were found to be inactive in 100 nm Ca2+ in the absence of ATP (control solution) at the start of the experiment. Trace 2, addition of 4 mm ATP to the cis bath (local perfusion) activated the channel. Traces 3-6, after 8 min the channel activation by ATP could be completely reversed by flowing the control solution onto the channel. In the same experiment, solutions containing 4 mm ATP plus adenosine reversibly inhibited channel activity. Note the higher concentrations of adenosine used compared to Fig. 1.
Figure 3
Figure 3. The response of RyR Po to ATP and AMP
Experimental conditions are given in Fig. 1. A, the average response of RyR Po to ATP and AMP. The data points show the means and s.e.m. of RyRs when exposed to cis ATP (•, n = 32) or to cis AMP (○, n = 19). The continuous curves show Hill curves (eqn (1)) fitted to the data. For ATP the fit parameters are Pmax= 0.33 ± 0.04, Ka= 0.48 ± 0.17, nH= 1.1 ± 0.7 and for AMP Pmax= 0.09 ± 0.02, Ka= 1.4 ± 0.3, nH= 1.9 ± 0.5. The inset shows the same data plotted with a linear abscissa. B, examples of the response to ATP of individual RyRs spanning the full range of observed Pmax.
Figure 4
Figure 4. Frequency distribution of maximum open probability (Pmax) of RyRs activated by ATP and AMP, showing the considerable variation between individual channels
RyR activity was measured under experimental conditions given in Fig. 1 at cytoplasmic Ca2+ and nucleotide concentrations indicated. Over these ranges of [ATP] and [AMP] RyRs were near-maximally activated so that Po values approximate the Pmax for that RyR and nucleotide (see eqn (1)).
Figure 5
Figure 5. The inhibitory effect of adenosine in the presence of various concentrations of ATP and AMP
A, pooled data showing the inhibitory dose-response behaviour of RyRs to adenosine in the presence of ATP at the following concentrations (mm): 0.2 (○, n = 5), 0.25 (▴, n = 5), 0.5 (▪, n = 14), 1 (▵, n = 5), 2 (•, n = 9), 4 (□, n = 9) and 8 (♦, n = 3). Channel activity is given as the mean and s.e.m. of open probability normalised in each experiment to that in the absence of adenosine. B, the half-inhibitory concentration of adenosine (Ki) in the presence of various concentrations of ATP (•) and AMP (○). Means and s.e.m. of Ki were determined from least squares fits of the individual adenosine dose-response data combined from all experiments under each experimental condition. Ki shows biphasic dependence on [ATP]. Over the range 0.2-0.5 mm, ATP has little effect on Ki whereas at higher [ATP], Ki increases ∼4-fold for each 2-fold increase in [ATP]. Ki for adenosine was similar in the presence of either ATP or AMP. The curves in A and B show model fits to the ATP data (continuous lines) and the AMP data (dotted line) based on Scheme 2. The values for the parameters of Scheme 2 are: KATP= KATP2= 0.4 mm, KAMP= KAMP2= 0.45 mm, Kad= Kad2= 0.06 mm.
Figure 6
Figure 6. Pooled data showing that cis IMP has no significant effect on the activity of RyRs activated by either 0.5 mm ATP (•, n = 5) or 2 mm ATP (○, n = 4)
Experimental conditions are given in Fig. 1. Channel activity is shown by the mean and s.e.m. of Po normalised in each experiment to that in the absence of IMP.
Figure 7
Figure 7. Effect of nucleotides on the mean open and closed dwell times of RyRs
A and B, effect of ATP concentration on the mean open (τo, A) and closed (τc, B) dwell times of representative RyRs. Pmax values shown here cover the full range of activating levels induced by ATP. Pmax values obtained for each RyR are as follows: ▴, -0.96; •, -0.64; ▪, -0.6; ⋄, -0.12; ▵, -0.11; ○, -0.02. C and D, summaries of all mean open (τo, C) and closed (τc, D) dwell times data, showing the effect of ATP (0-8 mm, ▴) and AMP (0-5 mm, □) activation and adenosine (0-10 mm, ○) inhibition of RyRs. Here, dwell times are plotted against the degree of channel activation (Po) rather than nucleotide concentration. In all cases, nucleotide regulation of Po was associated with changes in mean closed dwell times. However, when Po exceeded ∼0.2, nucleotides had a relatively strong effect on the mean open dwell times. The dashed line in C shows the duration of the shortest detectable gating events.
Figure 8
Figure 8. Effects of adenosine inhibition on the mean open (τo, A) and closed (τc, B) dwell times of four representative RyRs
Adenosine inhibition was produced in the presence of 0.5 mm ATP and is shown here for two RyRs that were strongly activated by ATP (•, Pmax= 0.64; ▪, Pmax= 0.67) and for another two that were weakly activated by ATP (○, Pmax= 0.03; □, Pmax= 0.06). In all cases adenosine increased the mean closed dwell times but only decreased the open dwell times of RyRs that had been strongly activated by ATP.
Figure 9
Figure 9. Dwell-time probability distributions obtained from RyRs activated by ATP and inhibited by adenosine
These RyRs showed behaviour representative of the high activity (A and B) and low activity (C and D) RyRs seen in this study. Probability distributions were constructed using the method of Sigworth & Sine (1987) where data were grouped into bins that are equally spaced on a log scale. Using this method, an exponentially decaying distribution is transformed to peaked distribution, where the peak is located at a time equal to its time constant. The continuous curves show examples of the individual exponential components of theoretical curves fitted with the data. A and B, ○, Po= 0.0017. Data were compiled from 123 gating events in an 80 s recording, in the absence of nucleotides. ▴, Po= 0.63. Data compiled from 1910 gating events in a 60 s recording, in the presence of 0.5 mm ATP. There is a considerable increase in the probability of long open events and short closed events. The individual exponential components of an exponential fit to the open data are shown by the continuous curves. •, Po= 0.05. Data compiled from 2920 gating events in a 100 s recording, in the presence of 0.5 mm ATP plus 0.8 mm adenosine. Inhibition increases the probability of long closures and short openings. The open dwell time distribution of the RyR in the presence of ATP and adenosine is very similar to that in the absence of nucleotides. C and D, ○, Po= 0.0084. Data were compiled from 548 gating events in a 60 s recording, in the presence of low (0.1 mm) ATP. ▴, Po= 0.07. Data compiled from 3630 gating events in a 60 s recording, in the presence of 0.5 mm ATP. As with the high activity RyR, there is a considerable increase in the probability of short closed events. However, the open time distribution is unchanged. The individual exponential components in the open and closed data are shown by the continuous curves. •, Po= 0.0089. Data compiled from 670 gating events in an 80 s recording, in the presence of 0.5 mm ATP plus 0.5 mm adenosine. Inhibition increases the probability of long closures but unlike the high activity channel adenosine has no effect on the openings. Once again, the open dwell time distribution of the RyR in the presence of ATP and adenosine is very similar to that in the absence of nucleotide. The parameters of the fitted curves (i.e. the time constants, τ (ms), and relative areas, A, of each exponential component) in each panel are listed in pairs (τ, A): B, 1.0, 0.22; 7.3, 0.44; 41, 0.34; C, 2.2, 0.30; 17, 0.55; 52, 0.15; D, 0.54, 0.76; 2.2, 0.24.
None
None

References

    1. Allen DG, Lännergren J, Westerblad H. Muscle cell function during prolonged activity: cellular mechanisms of fatigue. Experimental Physiology. 1995;80:497–527. - PubMed
    1. Allen DG, Lännergren J, Westerblad H. The role of ATP in the regulation of intracellular Ca2+ release in single fibres of mouse skeletal muscle. Journal of Physiology. 1997;498:587–600. - PMC - PubMed
    1. Blazev R, Lamb GD. Low [ATP] and elevated [Mg2+] reduce depolarization-induced Ca2+ release in rat skinned skeletal muscle fibres. Journal of Physiology. 1999a;520:203–215. - PMC - PubMed
    1. Blazev R, Lamb GD. Adenosine inhibits depolarization-induced Ca2+ release in mammalian skeletal muscle. Muscle and Nerve. 1999b;22:1674–1683. - PubMed
    1. Brooks SP, Storey KB. Bound and determined: a computer program for making buffers of defined ion concentrations. Annals of Biochemistry. 1992;201:119–126. - PubMed

Publication types

MeSH terms

LinkOut - more resources