

Activation of ATP-sensitive K(+) channels by epoxyeicosatrienoic acids in rat cardiac ventricular myocytes
- PMID: 11744757
- PMCID: PMC2278996
- DOI: 10.1111/j.1469-7793.2001.00811.x
Activation of ATP-sensitive K(+) channels by epoxyeicosatrienoic acids in rat cardiac ventricular myocytes
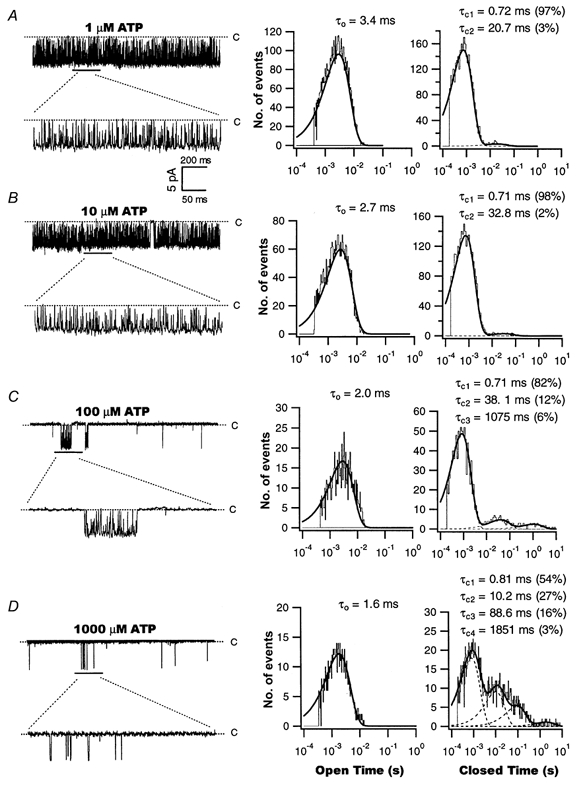
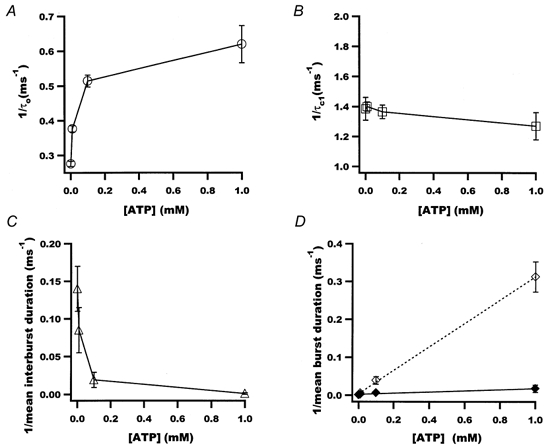
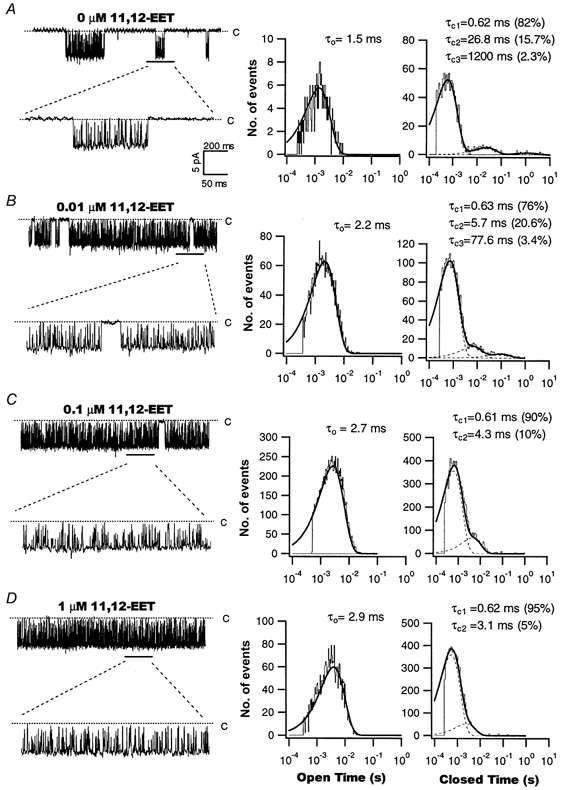
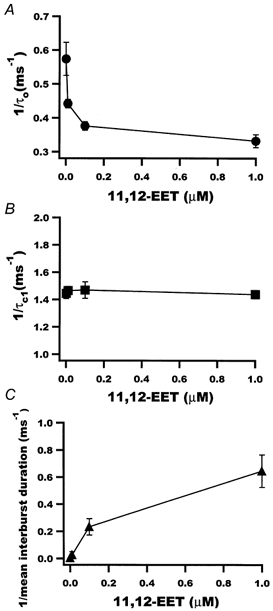
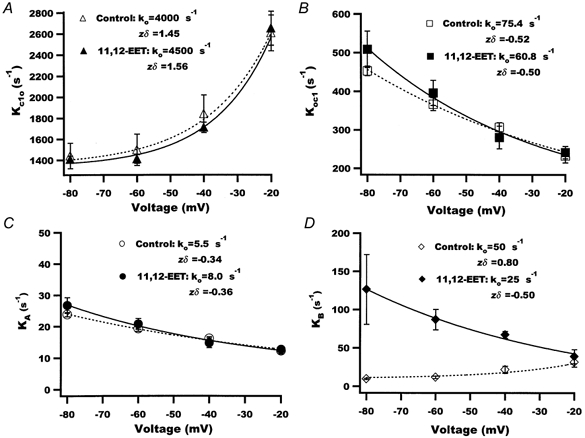
Abstract
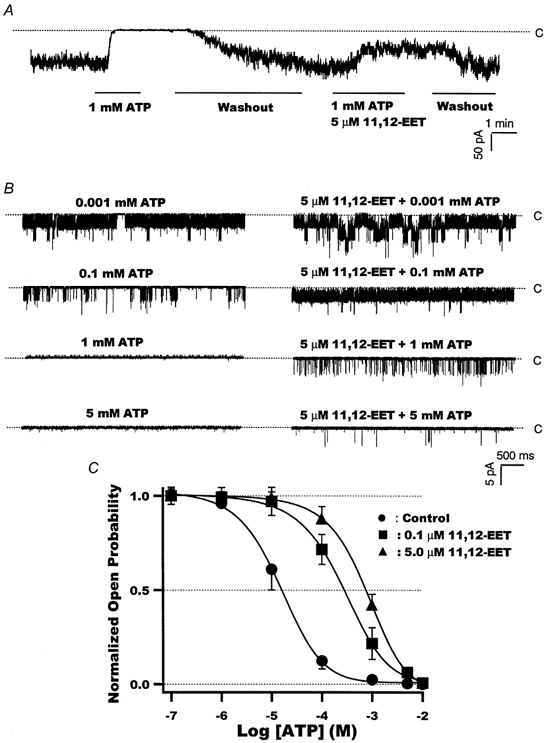
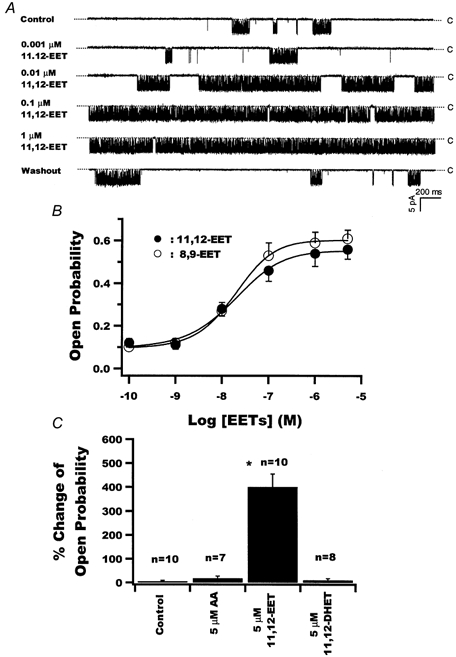
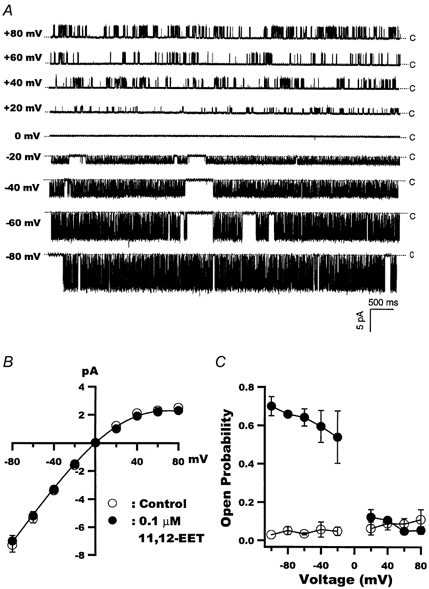
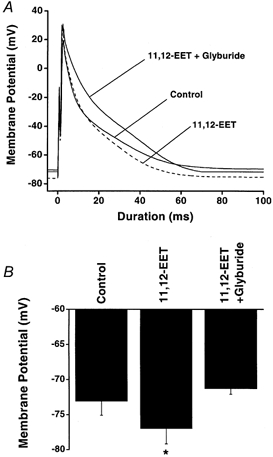
1. We examined the effects of epoxyeicosatrienoic acids (EETs), which are cytochrome P450 metabolites of arachidonic acid (AA), on the activities of the ATP-sensitive K(+) (K(ATP)) channels of rat cardiac myocytes, using the inside-out patch-clamp technique. 2. In the presence of 100 microM cytoplasmic ATP, the K(ATP) channel open probability (P(o)) was increased by 240 +/- 60 % with 0.1 microM 11,12-EET and by 400 +/- 54 % with 5 microM 11,12-EET (n = 5-10, P < 0.05 vs. control), whereas neither 5 microM AA nor 5 microM 11,12-dihydroxyeicosatrienoic acid (DHET), which is the epoxide hydrolysis product of 11,12-EET, had any effect on P(o). 3. The half-maximal activating concentration (EC(50)) was 18.9 +/- 2.6 nM for 11,12-EET (n = 5) and 19.1 +/- 4.8 nM for 8,9-EET (n = 5, P = n.s. vs. 11,12-EET). Furthermore, 11,12-EET failed to alter the inhibition of K(ATP) channels by glyburide. 4. Application of 11,12-EET markedly decreased the channel sensitivity to cytoplasmic ATP. The half-maximal inhibitory concentration of ATP (IC(50)) was increased from 21.2 +/- 2.0 microM at baseline to 240 +/- 60 microM with 0.1 microM 11,12-EET (n = 5, P < 0.05 vs. control) and to 780 +/- 30 microM with 5 microM 11,12-EET (n = 11, P < 0.05 vs. control). 5. Increasing the ATP concentration increased the number of kinetically distinguishable closed states, promoting prolonged closure durations. 11,12-EET antagonized the effects of ATP on the kinetics of the K(ATP) channels in a dose- and voltage-dependent manner. 11,12-EET (1 microM) reduced the apparent association rate constant of ATP to the channel by 135-fold. 6. Application of 5 microM 11,12-EET resulted in hyperpolarization of the resting membrane potential in isolated cardiac myocytes, which could be blocked by glyburide. 7. These results suggest that EETs are potent activators of the cardiac K(ATP) channels, modulating channel behaviour by reducing the channel sensitivity to ATP. Thus, EETs could be important endogenous regulators of cardiac electrical excitability.
Figures
Similar articles
-
Dihydroxyeicosatrienoic acids are potent activators of Ca(2+)-activated K(+) channels in isolated rat coronary arterial myocytes.J Physiol. 2001 Aug 1;534(Pt 3):651-67. doi: 10.1111/j.1469-7793.2001.t01-1-00651.x. J Physiol. 2001. PMID: 11483698 Free PMC article.
-
Effects of epoxyeicosatrienoic acids on the cardiac sodium channels in isolated rat ventricular myocytes.J Physiol. 1999 Aug 15;519 Pt 1(Pt 1):153-68. doi: 10.1111/j.1469-7793.1999.0153o.x. J Physiol. 1999. PMID: 10432346 Free PMC article.
-
Stereospecific activation of cardiac ATP-sensitive K(+) channels by epoxyeicosatrienoic acids: a structural determinant study.Mol Pharmacol. 2002 Nov;62(5):1076-83. doi: 10.1124/mol.62.5.1076. Mol Pharmacol. 2002. PMID: 12391270
-
Cyclic AMP-dependent modulation of cardiac L-type Ca2+ and transient outward K+ channel activities by epoxyeicosatrienoic acids.Prostaglandins Other Lipid Mediat. 2007 Jan;82(1-4):11-8. doi: 10.1016/j.prostaglandins.2006.05.023. Epub 2006 Jul 7. Prostaglandins Other Lipid Mediat. 2007. PMID: 17164128 Review.
-
CYP2J2-mediated metabolism of arachidonic acid in heart: A review of its kinetics, inhibition and role in heart rhythm control.Pharmacol Ther. 2024 Jun;258:108637. doi: 10.1016/j.pharmthera.2024.108637. Epub 2024 Mar 22. Pharmacol Ther. 2024. PMID: 38521247 Review.
Cited by
-
Role of epoxyeicosatrienoic acids in protecting the myocardium following ischemia/reperfusion injury.Prostaglandins Other Lipid Mediat. 2007 Jan;82(1-4):50-9. doi: 10.1016/j.prostaglandins.2006.05.017. Epub 2006 Jul 10. Prostaglandins Other Lipid Mediat. 2007. PMID: 17164132 Free PMC article. Review.
-
Cytochrome P450 epoxygenase pathway of polyunsaturated fatty acid metabolism.Biochim Biophys Acta. 2015 Apr;1851(4):356-65. doi: 10.1016/j.bbalip.2014.07.020. Epub 2014 Aug 2. Biochim Biophys Acta. 2015. PMID: 25093613 Free PMC article. Review.
-
Electrophysiological properties of cardiomyocytes isolated from CYP2J2 transgenic mice.Mol Pharmacol. 2007 Oct;72(4):1063-73. doi: 10.1124/mol.107.035881. Epub 2007 Jul 24. Mol Pharmacol. 2007. PMID: 17652182 Free PMC article.
-
Cytochrome P450 metabolites of arachidonic acid play a role in the enhanced cardiac dysfunction in diabetic rats following ischaemic reperfusion injury.Auton Autacoid Pharmacol. 2009 Jan;29(1-2):33-41. doi: 10.1111/j.1474-8673.2009.00429.x. Auton Autacoid Pharmacol. 2009. PMID: 19302554 Free PMC article.
-
Overexpression of cytochrome P450 epoxygenases prevents development of hypertension in spontaneously hypertensive rats by enhancing atrial natriuretic peptide.J Pharmacol Exp Ther. 2010 Sep 1;334(3):784-94. doi: 10.1124/jpet.110.167510. Epub 2010 May 25. J Pharmacol Exp Ther. 2010. PMID: 20501636 Free PMC article.
References
-
- Aguilar-Bryan L, Clement JP, IV, Gonzalez G, Kunjilwar K, Babenko A, Bryan J. Toward understanding the assembly and structure of KATP channels. Physiological Reviews. 1998;78:227–245. - PubMed
-
- Ashcroft FM. Exciting times for PIP2. Science. 1998;282:1159–1160. - PubMed
-
- Ashcroft FM, Gribble FM. Correlating structure and function in ATP-sensitive K+ channels. Trends in Neurosciences. 1998;21:288–294. - PubMed
-
- Ashcroft SJ, Ashcroft FM. Properties and function of ATP-sensitive K-channels. Cellular Signaling. 1990;2:197–214. - PubMed
Publication types
MeSH terms
Substances
Grants and funding
LinkOut - more resources
Full Text Sources
Miscellaneous