. 2001 Dec 15;537(Pt 3):871-85.
doi: 10.1111/j.1469-7793.2001.00871.x.

Physiological stimuli evoke two forms of endocytosis in bovine chromaffin cells

Affiliations

Physiological stimuli evoke two forms of endocytosis in bovine chromaffin cells

S A Chan et al. J Physiol. .

Abstract

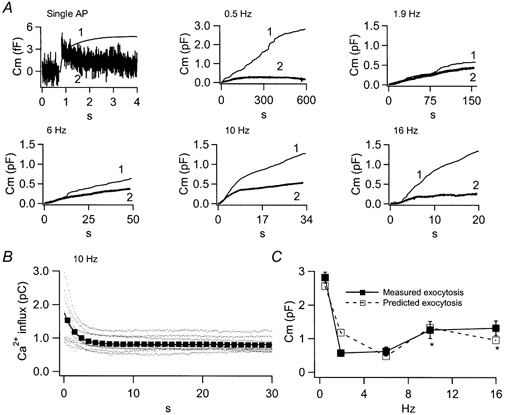
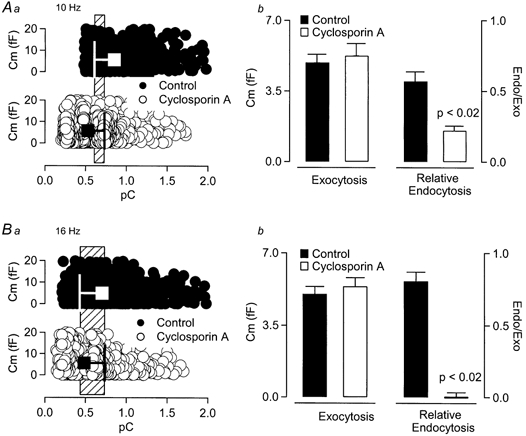
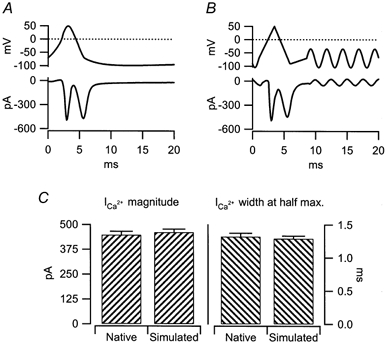
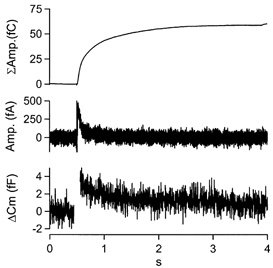
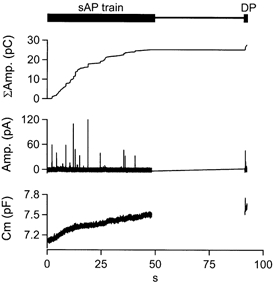
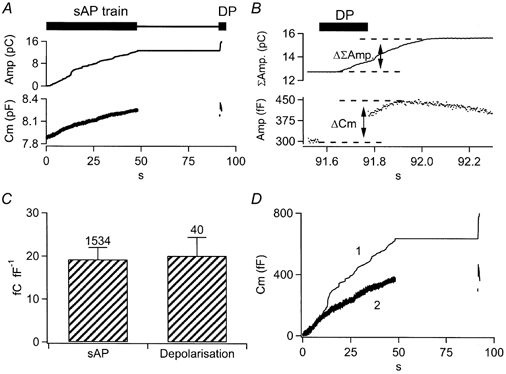
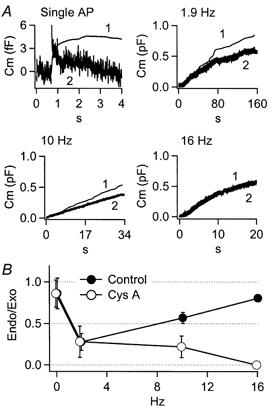
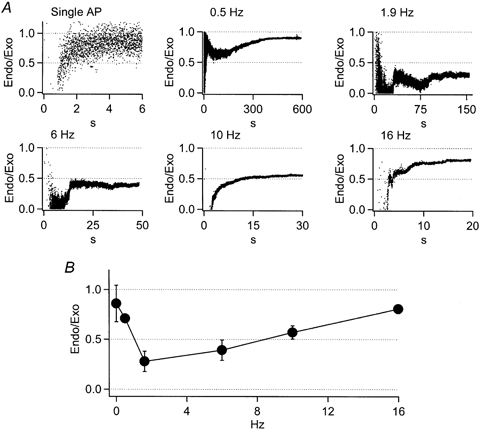
1. Exocytosis and endocytosis were measured following single, or trains of, simulated action potentials (sAP) in bovine adrenal chromaffin cells. Catecholamine secretion was measured by oxidative amperometry and cell membrane turnover was measured by voltage clamp cell capacitance measurements. 2. The sAPs evoked inward Na(+) and Ca(2+) currents that were statistically identical to those evoked by native action potential waveforms. On average, a single secretory granule underwent fusion following sAP stimulation. An equivalent amount of membrane was then quickly internalised (tau = 560 ms). 3. Stimulation with sAP trains revealed a biphasic relationship between cell firing rate and endocytic activity. At basal stimulus frequencies (single to 0.5 Hz) cells exhibited a robust membrane internalisation that then diminished as firing increased to intermediate levels (1.9 and 6 Hz). However at the higher stimulation rates (10 and 16 Hz) endocytic activity rebounded and was again able to effectively maintain cell surface near pre-stimulus levels. 4. Treatment with cyclosporin A and FK506, inhibitors of the phosphatase calcineurin, left endocytosis characteristics unaltered at the lower basal stimulus levels, but blocked the resurgence in endocytosis seen in control cells at higher sAP frequencies. 5. Based on these findings we propose that, under physiological electrical stimulation, chromaffin cells internalise membrane via two distinct pathways that are separable. One is prevalent at basal stimulus frequencies, is lessened with increased firing, and is insensitive to cyclosporin A and FK506. A second endocytic form is activated by increased firing frequencies, and is selectively blocked by cyclosporin A and FK506.


Figures

Figure 5
Figure 5. Cell capacitance and integrated amperometry vary with cell activity
A, the scaled integrated amperometric response (traces 1) and measured cell capacitance (traces 2) are plotted for 6 different stimulation conditions. For the single AP, 16 cells were stimulated with a total of 1534 sAPs. Trains contained 300 sAPs each and were recorded at the following frequencies: 0.5 Hz, n = 9 cells; 1.9 Hz, n = 9 cells; 6 Hz, n = 7 cells; 10 Hz, n = 12 cells; and 16 Hz, n = 9 cells. B, the calcium influx for each sAP of the stimulus trains was measured (10 Hz data plotted as an example, dots). The data were then binned into groups of 10 and averaged (squares). The binned averages were fitted with a mono-exponential decay (continuous line), reflecting activity-dependent current rundown. The fitted line from each frequency then served as the input Ca2+ function for a kinetic simulation of exocytosis. C, the magnitude of total evoked exocytosis from A was simulated with a kinetic model for secretion based on the ‘two step model for secretion control’ (see Results for references). The results of the simulation and the measured exocytosis values are plotted for comparison. Conditions in which Ca2+ activation of protein kinase C is expected, and is so modelled are marked with an asterisk.
Figure 8
Figure 8. Cyclosporin A does not alter endocytosis by lowering Ca2+ influx
Aa, data measured from individual sAP stimuli in control and cyclosporin A-treated cells are plotted against evoked Ca2+ influx. Large square symbols represent the mean ±s.d. The range representing overlap of mean plus or minus 1 standard deviation (common range) is highlighted by the hatched box in the background. b, the average exocytosis and relative endocytosis values within the common range (hatched region from a) are presented for comparison. While, at comparable Ca2+, control and treated cells displayed similar exocytic activity, cyclosporin A decreased relative endocytosis from control (Student's t test, P < 0.02). B, the same analysis as that represented in A was repeated for cells stimulated at 16 Hz. Again, at comparable Ca2+ influx, cyclosporin A treatment did not significantly affect exocytic activity, but blocked endocytosis (Student's t test, P < 0.02).
Figure 1
Figure 1. Native action potentials are approximated by ramp voltage protocols
A, isolated chromaffin cells were held in the whole cell current clamp configuration and injected with 100 μs, 100 pA currents. The resulting action potential was measured and then utilised as a stimulus template in perforated patch voltage clamp recordings. The stimulus template (upper trace) and resulting evoked currents (lower trace) were measured and averaged from 100 stimuli in 4 cells (0.02 Hz). B, a 3-component ramp protocol was designed to mimic as closely as possible the native stimulus wave form presented in A. The ramp segments were as follows (start potential, end potential, duration): -70 mV, 50 mV, 2.5 ms; 50 mV, -90 mV, 2.5 ms; -90 mV, -70 mV, 2.52 ms. Again, evoked currents were measured and averaged in response to 100 stimuli in 4 cells (0.02 Hz). As in A, the stimulus template (upper trace) and evoked currents (lower trace) are plotted. C, the magnitude (left) and width at half-maximum current (right) of the Ca2+ influx measured in response to the native and simulated action potentials were quantified. Both measures were statistically identical between stimulus groups (Student's t test, P < 0.02).
Figure 2
Figure 2. Single sAP stimuli evoke exocytosis followed by a robust membrane internalisation
Cells (n = 16) were stimulated with a total of 1534 sAPs in the perforated patch voltage clamp configuration at 0.02 Hz. Cell capacitance (lower trace) and amperometric current (middle trace) were measured. The traces were signal averaged with respect to the stimulus. sAP stimulation resulted in a rapid jump in cell capacitance, followed by a decrease. The averaged amperometric signal was integrated (upper trace) to generate an estimate of total exocytosis.
Figure 3
Figure 3. sAP trains incorporate a calibration square pulse depolarisation
A single chromaffin cell was stimulated with a train of 300 sAPs at 6 Hz. Cell capacitance (lower trace) and amperometric current (middle trace) were measured during the train (sAP train) and a delayed 200 ms depolarising pulse (DP). The amperometric current was then integrated off-line (upper trace) in order to give an index of cumulative catecholamine release.
Figure 4
Figure 4. Integrated amperometric currents can be scaled to the capacitance trace
A, chromaffin cells were stimulated with the sAP-DP protocol presented in Fig. 3. Cell capacitance (lower trace) and integrated amperometric current (upper trace) were averaged from a total of 7 cells at 6 Hz. B, the same capacitance and integrated amperometry traces from A are expanded for the time frame encompassing the DP calibration pulse. The signals evoked by the 200 ms depolarisation are highlighted and the offsets used for scaling are labelled (ΔΣamp. and ΔCm). C, amperometric charge is plotted as a function of capacitance increase for sAP and DP stimuli. There was no statistical difference between sAP and DP values (Student's t test, P > 0.02). Numbers indicate the events averaged in each case. D, following scaling to the DP, integrated amperometric charge (trace 1) and cell capacitance (trace 2) are plotted for the same data set shown in A and B.
Figure 7
Figure 7. Cyclosporin A pre-treatment selectively blocks endocytosis at higher frequencies
Cells were treated for 10 min in extracellular Ringer solution containing 1 μm cyclosporin A prior to recording. A, integrated scaled amperometry (trace 1) and cell capacitance (2) are presented for single sAP stimuli (n = 14 cells, 328 sAPs), 1.9 Hz (n = 6 cells), 10 Hz (n = 15 cells) and 16 Hz (n = 8 cells). B, endocytosis was quantified as reported for control cells in Fig. 6, and is presented for the cyclosporin A-treated and control cells for comparison. These data show that cyclosporin A treatment significantly lessens endocytosis at 10 Hz, and completely blocks endocytosis at 16 Hz.
Figure 6
Figure 6. Endocytosis efficiency follows a biphasic frequency dependency
A, endocytic efficiency was calculated for each stimulation condition as: The points in each plot of A represent the proportion of membrane retrieved to that added at a given time point, or the time resolved endocytic efficiency measured during the train. B, the steady-state endocytic efficiency for each stimulation condition was determined as the mean value over the final 20 % of the efficiency curve. The endocytosis efficiency is plotted against stimulus frequency as mean ±s.d.

Similar articles

Cited by

References

    1. Artalejo CR, Elhamdani A, Palfrey HC. Calmodulin is the divalent cation receptor for rapid endocytosis, but not exocytosis, in adrenal chromaffin cells. Neuron. 1996;16:195–205. - PubMed
    1. Artalejo CR, Elhamdani A, Palfrey HC. Secretion: dense-core vesicles can kiss-and-run too. Current Biology. 1998;8:R62–65. - PubMed
    1. Artalejo CR, Henley JR, McNiven MA, Palfrey HC. Rapid endocytosis coupled to exocytosis in adrenal chromaffin cells involves Ca2+, GTP, and dynamin but not clathrin. Proceedings of the National Academy of Sciences of the USA. 1995;92:8328–8332. - PMC - PubMed
    1. Artalejo CR, Lemmon MA, Schlessinger J, Palfrey HC. Specific role for the pH domain of dynamin-1 in the regulation of rapid endocytosis in adrenal chromaffin cells. EMBO Journal. 1997;16:1565–1574. - PMC - PubMed
    1. Aunis D. Exocytosis in chromaffin cells of the adrenal medulla. International Review of Cytology. 1998;181:213–320. - PubMed

Publication types

LinkOut - more resources