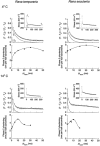
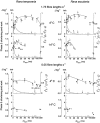
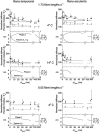
. 2001 Dec 15;537(Pt 3):923-39.
doi: 10.1111/j.1469-7793.2001.00923.x.

Energy transfer during stress relaxation of contracting frog muscle fibres

Affiliations

Energy transfer during stress relaxation of contracting frog muscle fibres

M Mantovani et al. J Physiol. .

Abstract

1. A contracting muscle resists stretching with a force greater than the force it can exert at a constant length, T(o). If the muscle is kept active at the stretched length, the excess tension disappears, at first rapidly and then more slowly (stress relaxation). The present study is concerned with the first, fast tension decay. In particular, it is still debated if and to what extent the fast tension decay after a ramp stretch involves a conservation of the elastic energy stored during stretching into cross-bridge states of higher chemical energy. 2. Single muscle fibres of Rana temporaria and Rana esculenta were subjected to a short ramp stretch (approximately 15 nm per half-sarcomere at either 1.4 or 0.04 sarcomere lengths s(-1)) on the plateau of the force-length relation at temperatures of 4 and 14 degrees C. Immediately after the end of the stretch, or after discrete time intervals of fixed-end contraction and stress relaxation at the stretched length (Delta t(isom) = 0.5-300 ms), the fibre was released against a force ~T(o). Fibre and sarcomere stiffness during the elastic recoil to T(o) (phase 1) and the subsequent transient shortening against T(o) (phase 2), which is expression of the work enhancement by stretch, were measured after different Delta t(isom) and compared with the corresponding fast tension decay during Delta t(isom). 3. The amplitude of fast tension decay is large after the fast stretch, and small or nil after the slow stretch. Two exponential terms are necessary to fit the fast tension decay after the fast stretch at 4 degrees C, whereas one is sufficient in the other cases. The rate constant of the dominant exponential term (0.1-0.2 ms(-1) at 4 degrees C) increases with temperature with a temperature coefficient (Q(10)) of approximately 3. 4. After fast stretch, the fast tension decay during Delta t(isom) is accompanied in both species and at both temperatures by a corresponding increase in the amplitude of phase 2 shortening against T(o) after Delta t(isom): a maximum of approximately 5 nm per half-sarcomere is attained when the fast tension decay is almost complete, i.e. 30 ms after the stretch at 4 degrees C and 10 ms after the stretch at 14 degrees C. After slow stretch, when fast tension decay is small or nil, the increase in phase 2 shortening is negligible. 5. The increase in phase 2 work during fast tension decay (Delta W(out)) is a constant fraction of the elastic energy simultaneously set free by the recoil of the undamped elastic elements. 6. Delta W(out) is accompanied by a decrease in stiffness, indicating that it is not due to a greater number of cross-bridges. 7. It is concluded that, during the fast tension decay following a fast ramp stretch, a transfer of energy occurs from the undamped elastic elements to damped elements within the sarcomeres by a temperature-dependent mechanism with a dominant rate constant consistent with the theory proposed by A. F. Huxley and R. M. Simmons in 1971.


Figures
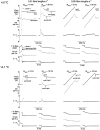
Figure 1
Figure 1. Example of experimental tracings from which stretch amplitude, phase 1 elastic recoil and phase 2 shortening against To were determined
Oscilloscope traces of length and tension changes recorded from one fibre at 4.0 °C (top panels) and 14.1 °C (bottom panels), using fast ramp stretches (1.81 fibre lengths s−1, left panels) or slow ramp stretches (0.05 fibre lengths s−1, right panels), are shown as a function of time on a slow time scale (three top traces in each panel) or a fast time scale (three bottom traces in each panel). When available, the sarcomere length changes measured by a striation follower (thin records) are shown directly beneath the fibre length changes measured by the position of a linear coil motor. The left-hand traces in each panel show tetani in which the fibre is released to To immediately after the end of the ramp stretch, whereas the right-hand traces show tetani in which the fibre is released to To after an isometric delay, Δtisom, of either 30 ms at the low temperature or 10 ms at the high temperature. Note that: (i) the amplitude of isotonic shortening against To (phase 2) increases with Δtisom after fast stretches when T/To is high, but not after slow stretches when T/To is low; (ii) T/To is higher at lower temperature than at higher temperature; and (iii) phase 2 duration decreases with temperature (see also Fig. 2). The characteristics of the Rana temporaria fibre are: contracting sarcomere length, ls,o= 2.18 μm; relaxed fibre length and cross-section at the end of the ramp, lf,o= 5.10 mm; and A = 7770 μm2. h.s., half-sarcomere.
Figure 2
Figure 2. Experimental tracings showing the effect of temperature, and of a delay between end of stretch and release to To on phase 2 shortening against To
Oscilloscope traces of phase 2 shortening against To measured at 4 °C (top four rows, four fibres, ad) and at 14 °C (bottom two rows, two fibres, c and d, illustrated on a threefold faster time scale). Phase 2 shortening was measured after the indicated time intervals (Δtisom= 0, 1, 5, 10, 20, 30, 50 and 300 ms) of fixed-end contraction following the end of a fast ramp stretch. Each column shows phase 2 tracings with similar shape and amplitude. For Δtisom= 0-50 ms, the thicker, upper tracing of each pair is recorded at the fibre end, whereas the thin, lower record (when available) is recorded simultaneously in a fibre segment. For Δtisom= 300 ms, the lower, thin record in each pair (‘isometric’) shows, for comparison, the phase 2 shortening measured at the fibre end after release to ∼0.9 To from a state of isometric contraction without pre-stretch. Note: (i) the similarity of the tracings recorded at the fibre end and in the fibre segment; (ii) the consistent changes in shape of the phase 2 velocity transient with Δtisom; (iii) a maximum of phase 2 shortening (column labelled ‘maximum amplitude’) is attained at Δtisom∼30 ms at 4 °C and at Δtisom= 5-10 ms at 14 °C; (iv) the tracings at 4 °C are similar to those at 14 °C shown on a threefold faster time scale, indicating that phase 2 is accelerated by temperature with a Q10 of ∼3. The characteristics of the Rana temporaria fibres are: (a) ls,o= 2.13 μm, lf,o= 5.37 mm and A = 16 690 μm2; (b) ls,o= 2.12 μm, lf,o= 5.00 mm and A = 13 660 μm2; (c) ls,o= 2.14 μm, lf,o= 6.30 mm and A = 15 730 μm2; and (d) same fibre as in Fig. 1.
Figure 3
Figure 3. Kinetics of the fast phase of stress relaxation and simultaneous increase of phase 2 shortening against To after fast ramp stretches
The left panels refer to one fibre of Rana temporaria and the right panels refer to one fibre of Rana esculenta at 4 °C (top) and 14 °C (bottom). The upper right inset in each panel shows the oscilloscope record of stress relaxation during Δtisom= 300 ms after a fast stretch. The first 50 ms of this record are expanded below the inset: the circles (superposed on the experimental points) are calculated from eqn (1). The first two exponential terms of eqn (1) at 4 °C (top), and the second term of eqn (1) at 14 °C (bottom) are plotted separately to indicate the component(s) of the fast phase of stress relaxation. The slow phase of stress relaxation (third term of eqn (1)) is not plotted separately because it is not pertinent to the present study. The bottom graph in each panel indicates the phase 2 shortening against To measured when release to To took place after the different Δtisom intervals indicated on the abscissa. The lines through the symbols are traced by eye. Note that: (i) in all cases, phase 2 shortening increases simultaneously with tension decay during the fast phase of stress relaxation, attaining a maximum near the end of it; and (ii) both tension decay and phase 2 increment are accelerated approximately threefold by a 10 °C increase in temperature. The characteristics of the two fibres are: Rana temporaria, same fibre as in Fig. 1; and Rana esculenta, ls,o= 2.19 μm, lf,o= 5.75 mm and A = 6810 μm2.
Figure 4
Figure 4. Average data of phase 2 shortening and work against To compared with the average trend of fast tension decay
Mean values (filled circles) of phase 2 shortening against To of fibres of Rana temporaria (left panels) and of Rana esculenta (right panels) released to To at discrete time intervals, Δtisom (abscissa) after the end of a fast ramp stretch (two upper panels) and a slow ramp stretch (bottom panels). In each panel, the upper graphs refer to 4 °C and the lower graphs to 14 °C. The mass-specific phase 2 work ordinate has been calculated from the phase 2 shortening ordinate and the average value of the isotonic load during phase 2 (∼To) in each group of data. The exponential terms of fast tension decay, rf and rff, are calculated from the average data given in Table 1 (except for the slow stretch at 14 °C where the fast phase of stress relaxation is nil). The vertical arrows indicate a value on the abscissa equal to 5τ, where τ is calculated as the reciprocal of the average rate constant rf in Table 1 (at 5τ, the amplitude of the exponential term is reduced by 99.3 %). The filled circles and error bars indicate, respectively, the mean and the s.d. of the mean (plotted for convenience on one side only of the symbol) of the number of measurements indicated beside the symbols; the lines through the symbols are traced by eye. The average data confirm the conclusions reached on one fibre in Fig. 3 after a fast stretch, i.e. the simultaneity of fast tension decay and phase 2 increment with a Q10 of ∼3 for both; in all cases, the maximum phase 2 shortening is attained before or at, but not after, the time when the fast tension decay is practically complete (arrows). Note also that, after a slow ramp stretch at 4 °C, when the amplitude of the fast phase of tension decay is less than half that after fast stretches, the increment in phase 2 work during the fast phase of stress relaxation is reduced, but the phase 2 work done immediately after the ramp WΔt = 0 is increased. The data are grouped, when applicable, into the following intervals along the abscissa: 0, 0.5-1, 2-3, 5-7, 10, 20, 30, 50, 100 and 300 ms (except for low velocity at 4 °C, where the intervals are 0, 5-10, 20, etc. for Rana temporaria, and 0, 5-10, 20-30, 50, etc. for Rana esculenta). The characteristics of the eight groups of fibres are as follows. Rana temporaria: fast stretch at 4 °C, lf,o= 5.65 ± 0.68 mm and A = 15 750 ± 6330 μm2 (n = 12); slow stretch at 4 °C, lf,o= 5.84 ± 0.60 mm and A = 15 870 ± 7110 μm2 (n = 7); and fast and slow stretch at 14 °C, lf,o= 5.70 ± 0.85 mm and A = 11 750 ± 5630 μm2 (n = 2). Rana esculenta: fast stretch at 4 °C, lf,o= 5.43 ± 0.41 mm and A = 7590 ± 2490 μm2 (n = 13); slow stretch at 4 °C, lf,o= 5.44 ± 0.43 mm and A = 7690 ± 1980 μm2 (n = 7); and fast and slow stretch at 14 °C, lf,o= 5.70 ± 0.18 mm and A = 9380 ± 2700 μm2 (n = 3).
Figure 5
Figure 5. Sarcomere and fibre stiffness compared with fast tension decay and phase 2 shortening against To
In each panel, the upper graph shows the sarcomere stiffness (•—•) and the fibre stiffness (○- - -○) during stress relaxation, whereas the lower graphs show, for comparison, the phase 2 shortening and the fast tension decay illustrated in Fig. 4. Stiffness is normalized by dividing the Young's modulus, measured during release (phase 1), by the isometric stress (So), measured before each ramp. The normalized stiffness measured during release from a state of isometric contraction to ∼0.9 To is indicated by the horizontal lines and corresponds to: at 4 °C, 161 ± 10 (n = 8) for the sarcomeres and 110 ± 13 (n = 11) for the fibre in Rana temporaria, 180 ± 34 (n = 9) for the sarcomeres and 133 ± 21 (n = 12) for the fibre in Rana esculenta; and at 14 °C, 100 ± 18 (n = 2) for the sarcomeres and 86 ± 20 (n = 2) for the fibre in Rana temporaria, and 119 ± 8 (n = 3) for the sarcomeres and 94 ± 13 (n = 3) for the fibre in Rana esculenta. As expected, sarcomere stiffness is greater than fibre stiffness, which includes the tendon compliance. Note that, after fast stretches: (i) stiffness decreases towards the isometric value during the fast phase of stress relaxation; (ii) when tension decay is accelerated by an increase in temperature, the stiffness decay is also accelerated similarly; (iii) the increase in phase 2 shortening is accompanied by a decrease in stiffness indicating that it is not due to an increase in the number of cross-bridges; and (iv) after slow stretches, when the fast phase of stress relaxation is small (4 °C) or nil (14 °C, data not shown), the stiffness changes are not significant. Data are derived from the same experiments as in Fig. 4; the number of data comprising the average shown by the open circles (fibre end) is the same as in Fig. 4 (except for one average), whereas, for the filled circles (sarcomeres), the numbers near the symbols indicate the number of usable striation follower records. Lines through the symbols are traced by eye.
Figure 6
Figure 6. Energy balance during stress relaxation after a fast ramp stretch
Left panels, Rana temporaria; right panels, Rana esculenta; upper panels, 4 °C; lower panels, 14 °C. The filled circles in each panel indicate the mechanical energy, Win, set free within the sarcomere context during stress relaxation of the undamped elastic elements. Win is calculated using eqn (2) for each tetanus, and averaged for equal or similar values of Δtisom, as indicated by the numbers near the squares. The open circles indicate the increase, during stress relaxation, in the mass-specific phase 2 work done against To, ΔWout, calculated for the same tetani using eqn (6). The filled squares indicate ΔWout - Win, calculated as eqn (6) minus eqn (2). All data are plotted as a function of the fall in force relative to To. The continuous and dotted lines are calculated as described in the text; the dashed line is traced by eye. Note that, during the fast phase of stress relaxation (Δtisom= 0-30 ms at 4 °C and 0-10 ms at 14 °C, corresponding to ΔT/To∼0-1 and ∼0-0.5, respectively, on the abscissa), the increase of Win is accompanied by a proportional increase of ΔWout, suggesting that some of the elastic energy delivered during stress relaxation is stored and recovered by damped structures within the sarcomere context. Data are derived from the same experiments as in Fig. 4 (fast stretches only and excluding Δtisom= 0; the number of data comprising the averages are the same as in Fig. 4, except for Rana temporaria at 4 °C where they are fewer because, in one experiment, the record for Δtisom= 0 was missing, and as a consequence, work measurements could not be made).
Figure 7
Figure 7. Effect of two different experimental protocols on the phase 2 tension transient after a shortening step imposed during lengthening
This figure shows one of some experiments made (in addition to those described in Methods) to clarify discussion about phase 2 duration. The upper graphs show, as a function of time, the length changes imposed at the fibre end by the motor in length feed-back mode. In the left tracing, the fibre is subjected to a large ramp stretch at 1.66 fibre lengths s−1, followed by a fast shortening step (50 μm complete in 220 μs) and by a period of isometric (fixed-end) contraction (Ramp-Step-Hold (RSH), a condition similar to that of the present study where force instead of length is kept constant after the step). In the right tracing, the fibre is subjected to the same ramp and step, but the ramp is continued after the step (Ramp-Step-Ramp (RSR), as in the experimental protocol of Piazzesi et al. 1992). The lower graphs show the force exerted by the fibre before and after the step; the inset on the right shows on an expanded time scale the force and length changes just before and after the step during tension recovery in the RSR protocol. Note that: (i) the shortening step is given when the force is almost steady during the ramp at ∼1.8 To; (ii) the recovery of tension after the step attains ∼1.2 To on the left (RSH protocol) and ∼1.8 To on the right (RSR protocol); and (iii) the tension recovery is complete in a time approximately tenfold shorter in the RSR protocol. The characteristics of the fibre are: Rana temporaria, lf,o= 6.4 mm, A = 10580 μm2 (3.7 °C).

Similar articles

Cited by

References

    1. Astumian RD. Thermodynamics and kinetics of a Brownian motor. Science. 1997;276:917–922. - PubMed
    1. Bressler BH, Dusik LA, Menard MR. Tension responses of frog skeletal muscle fibres to rapid shortening and lengthening step. Journal of Physiology. 1988;397:631–641. - PMC - PubMed
    1. Cavagna GA. Effect of temperature and velocity of stretching on stress relaxation of contracting frog muscle fibres. Journal of Physiology. 1993;462:161–173. - PMC - PubMed
    1. Cavagna GA, Dusman B, Margaria R. Positive work done by a previously stretched muscle. Journal of Applied Physiology. 1968;24:21–32. - PubMed
    1. Cavagna GA, Heglund NC, Harry JD, Mantovani M. Storage and release of mechanical energy by contracting frog muscle fibres. Journal of Physiology. 1994;481:689–708. - PMC - PubMed

Publication types

LinkOut - more resources