. 2001 Dec 15;537(Pt 3):979-92.
doi: 10.1111/j.1469-7793.2001.00979.x.

T-tubule localization of the inward-rectifier K(+) channel in mouse ventricular myocytes: a role in K(+) accumulation

Affiliations

T-tubule localization of the inward-rectifier K(+) channel in mouse ventricular myocytes: a role in K(+) accumulation

R B Clark et al. J Physiol. .

Abstract

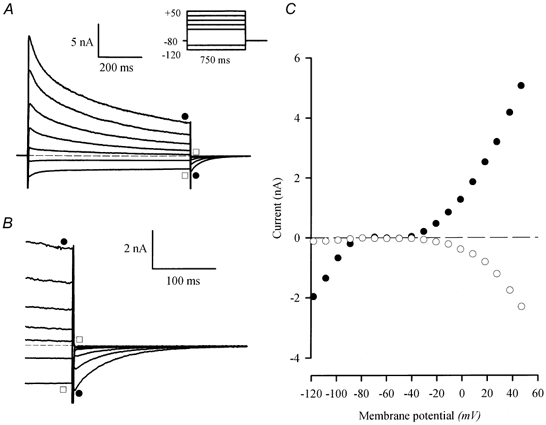
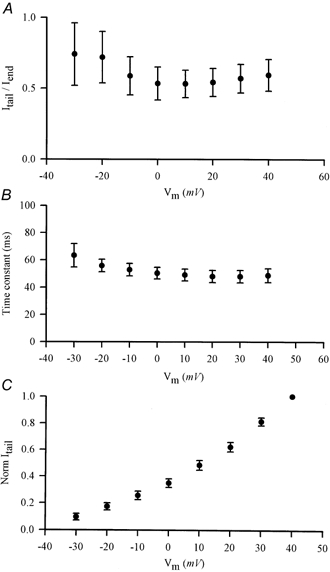
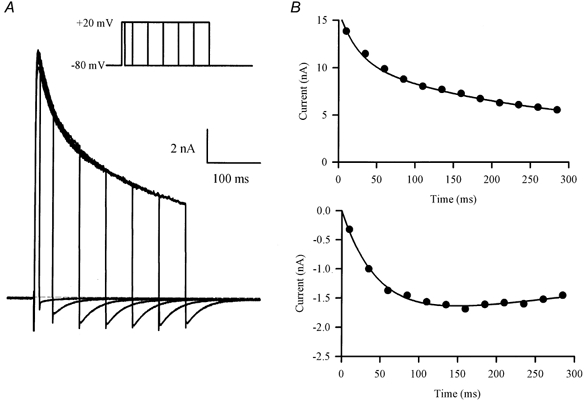
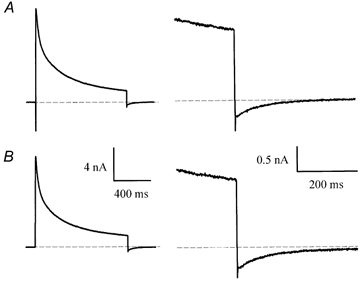
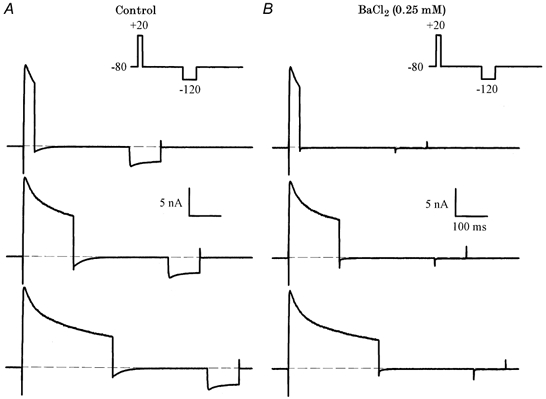
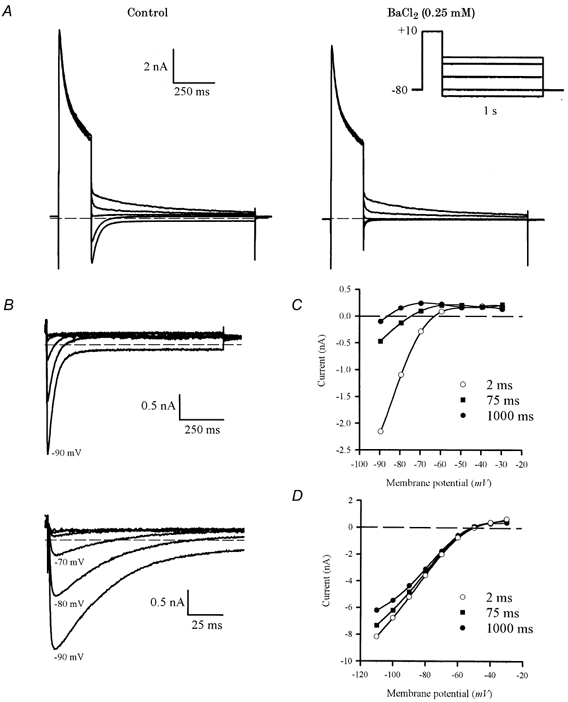
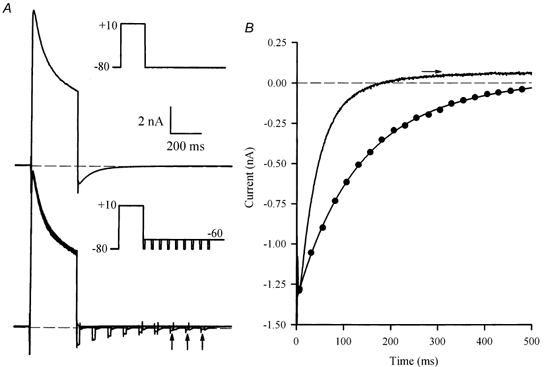
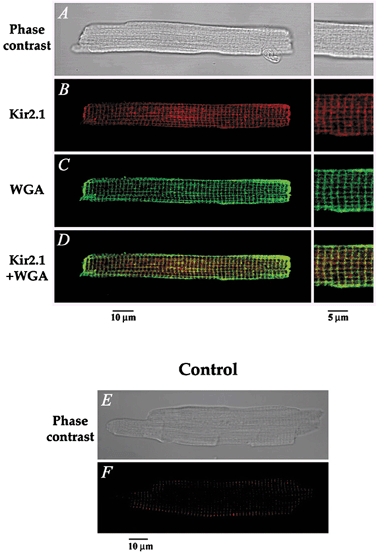
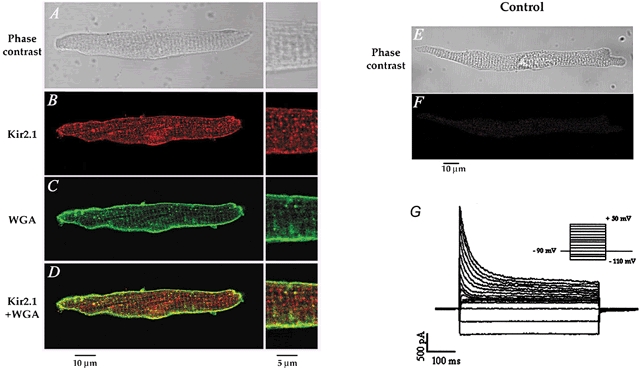
1. The properties of the slow inward 'tail currents' (I(tail)) that followed depolarizing steps in voltage-clamped, isolated mouse ventricular myocytes were examined. Depolarizing steps that produced large outward K(+) currents in these myocytes were followed by a slowly decaying inward I(tail) on repolarization to the holding potential. These currents were produced only by depolarizations: inwardly rectifying K(+) currents, I(K1), produced by steps to potentials negative to the holding potential, were not followed by I(tail). 2. For depolarizations of equal duration, the magnitude of I(tail) increased as the magnitude of outward current at the end of the depolarizing step increased. The apparent reversal potential of I(tail) was dependent upon the duration of the depolarizing step, and the reversal potential shifted to more depolarized potentials as the duration of the depolarization was increased. 3. Removal of external Na(+) and Ca(2+) had no significant effect on the magnitude or time course of I(tail). BaCl(2) (0.25 mM), which had no effect on the magnitude of outward currents, abolished I(tail) and I(K1) simultaneously. 4. Accordingly, I(tail) in mouse ventricular myocytes probably results from K(+) accumulation in a restricted extracellular space such as the transverse tubule system (t-tubules). The efflux of K(+) into the t-tubules during outward currents produced by depolarization shifts the K(+) Nernst potential (E(K)) from its 'resting' value (close to -80 mV) to more depolarized potentials. This suggests that I(tail) is produced by I(K1) in the t-tubules and is inward because of the transiently elevated K(+) concentration and depolarized value of E(K) in the t-tubules. 5. Additional evidence for the localization of I(K1) channels in the t-tubules was provided by confocal microscopy using a specific antibody against Kir2.1 in mouse ventricular myocytes.


Figures

Figure 1
Figure 1. Slow, inward ‘tail currents’, Itail, follow the depolarization of voltage-clamped, adult mouse ventricular myocytes
A, family of currents from a voltage-clamped, isolated mouse ventricular myocyte. The voltage-clamp protocol is shown in the inset; the holding potential was -80 mV; 0.75 s steps to potentials between -120 and 50 mV (-120, -100, -30, -10, 10, 30 and 50 mV) were applied at 0.1 Hz. Slowly decaying, inward currents followed the depolarizing (•), but not the hyperpolarizing (□), voltage-clamp steps. The dashed line indicates zero current in this, and all subsequent figures. B, currents at the end of the depolarizing steps and after repolarization to -80 mV are shown on expanded time and current scales. Note that the magnitude of the inward Itail increased as the magnitude of the outward current at the end of the step increased (•). No Itail followed hyperpolarizing steps (□). C, current-voltage relationship for currents obtained at the end of the voltage-clamp steps (•), and peak Itail (○).
Figure 2
Figure 2. Summary of the properties of Itail
A, plot of the ratio of magnitude of Itail to current at the end of the depolarizing step (Iend) as a function of the step potential. Data (means ±s.e.m.) were averaged from nine different ventricular myocytes. Slow Itail were measured at a holding potential of -80 mV. B, plot of the time constant of decay of Itail as a function of depolarizing step potential. Itail was fitted to single exponential functions. Data (means ±s.e.m.) were averaged from nine cells (same as in A). C, normalized magnitude of Itail, as a function of depolarizing step potential. Current magnitudes were normalized to Itail at +40 mV. Data (means ±s.e.m.) were averaged from nine cells (same as above).
Figure 3
Figure 3. Effect of duration of depolarization on the magnitude of Itail
A, family of currents produced by a series of voltage-clamp steps (20 mV) of increasing duration (10-285 ms; inset). Note that Itail increased in magnitude with increasing step duration, while the outward current at the end of each step decreased. B, plots of outward current at the end of the depolarizing step (upper graph) and Itail magnitude (lower graph), as a function of depolarizing step duration.
Figure 4
Figure 4. Itail is not generated by Na+-Ca2+ exchange
A, current produced by a 20 mV, 1 s voltage-clamp step in control Hepes-buffered solution. Right panel: current is shown on expanded time and current scales. B, current in the same cell, after removing external Na+ and Ca2+ (see Methods). Note that Itail was unaffected by the removal of Na+ and Ca2+.
Figure 5
Figure 5. Ba2+ blocks Itail and the inwardly rectifying K+ current, IK1, in mouse ventricular myocytes
A, voltage-clamp currents recorded in control solution. The voltage-clamp protocol (inset) consisted of a depolarizing step to 20 mV (35, 160, 285 ms), and a hyperpolarizing step to -120 mV (100 ms). The inward current produced by the hyperpolarizing step is IK1. B, currents after the addition of 0.25 mm BaCl2. Note that both Itail and IK1 were abolished, but there was no significant effect on the outward currents.
Figure 6
Figure 6. Reversal potential of BaCl2-sensitive Itail
A, voltage-clamp currents produced by a two-step protocol (right, inset), consisting of a 200 ms depolarizing step to +10 mV, followed by a series of 1 s steps to -30, -40, -60, -80 and -90 mV. In control conditions (left panel), the tail currents reversed near -60 mV. Large, inward currents were produced by steps to -80 and -90 mV. After the addition of 0.25 mm BaCl2 (right panel), the large inward Itail were almost completely abolished, but there was relatively little effect on the outward Itail. B, BaCl2-sensitive Itail, obtained by subtracting currents in BaCl2 from control currents. Voltage steps were from -30 to -90 mV, in 10 mV increments (-50 and -70 mV steps are not shown in A). The lower panel shows the initial parts of Itail on an expanded time scale. Note that the currents for -70 and -80 mV are initially inward, but become net outward within about 100 ms after the end of the depolarizing step. C, current-voltage relationship for BaCl2-sensitive Itail measured 2 ms (○), 75 ms (▪) and 1 s (•) after the end of the depolarizing step. D, current-voltage relationship for Itail measured at 2 ms (○), 75 ms (▪) and 1 s (•) after the end of the depolarizing step in an extracellular solution containing 20 mm K+. Smooth curves through each set of points are fifth-order polynomial regressions: reversal potentials for each set of points were obtained from these polynomials by interpolation (see text for values).
Figure 7
Figure 7. Time course of decay of Itail depends upon current flow
A, upper panel, voltage-clamp currents produced by a 300 ms, +10 mV step, from a holding potential of -80 mV (inset). A large inward Itail was produced on repolarization to -80 mV. Lower panel, series of superimposed currents produced by the same depolarizing step, but followed at different times by a 10 ms ‘test’ step to -80 mV, from a potential of -60 mV. Currents shown were produced by test steps that were applied between 0 and 400 ms after the end of the depolarizing step, in 50 ms increments (see inset). Vertical arrows indicate currents from test steps at 300, 350 and 400 ms. Time and current scales are the same for both panels. B, comparison of the time course of Itail recorded at a membrane potential of -80 mV (continuous line), and the magnitude of the test step currents as a function of time after the end of the depolarizing step (•). The dotted line through the test currents is a best-fit, double-exponential function, with time constants of 112.4 and 329.3 ms. The amplitudes of the fast and slow components were -1.03 and -0.38 nA, respectively. The horizontal arrow indicates the level of Itail (at -80 mV) at 1 s after the repolarizing step; the double-exponential function was constrained to fit to this level.
Figure 8
Figure 8. Immunofluorescent labelling of Kir2.1 and colocalization with wheat germ agglutinin (WGA) in mouse ventricular myocytes
A, phase-contrast image of a mouse ventricular cell, also presented in BD, using immunofluorescence detection. B, the red fluorescent staining indicates the presence of Kir2.1. C, the green coloration corresponds to WGA staining of the cell membrane. D, superimposition of both images shows significant colocalization (yellow) of Kir2.1 and WGA in the transverse striations, further confirming the t-tubular localization of Kir2.1. The panels on the right in AD show a higher magnification of the cell seen on the left. EF, negative controls showing that no staining was apparent when the primary antibody was omitted. E, phase contrast image, and F, immunofluorescence detection of the same cell.
Figure 9
Figure 9. No significant t-tubule localization of Kir2.1 in mouse atrial myocytes, consistent with the absence of Itail in these cells
A, phase-contrast image of a mouse atrial cell. BC, same cell as in A showing the immunofluorescence detection of Kir2.1 (B) and WGA (C). D, superimposition of the images presented in B and C, revealing little or no overlap (yellow) between Kir2.1 and WGA labelling in the t-tubules. E, phase-contrast image of the control atrial cell presented in F, showing that no immunofluorescence staining was observed when the primary antibody was omitted. G, family of currents from a voltage clamped, isolated mouse atrial myocyte. The voltage-clamp protocol is shown in the inset; the holding potential was -90 mV; 500 ms steps to potentials between -110 and +50 mV in 10 mV increments applied at 0.1 Hz.

Similar articles

Cited by

References

    1. Almers W. The decline of potassium permeablity during extreme hyperpolarization in frog skeletal muscle. Journal of Physiology. 1972;225:57–83. - PMC - PubMed
    1. Attwell DE, Cohen IS. The voltage clamp of multicellular preparations. Progress in Biophysics and Molecular Biology. 1977;31:201–245. - PubMed
    1. Attwell DE, Eisner DA, Cohen IS. Voltage clamp and tracer flux data: effects of a restricted extracellular space. Quarterly Review of Biophysics. 1979;12:213–263. - PubMed
    1. Bers DM, Lederer WJ, Berlin JR. Intracellular Ca transients in rat cardiac myocytes: role of Na-Ca exchange in excitation-contraction coupling. American Journal of Physiology. 1990;258:C944–954. - PubMed
    1. Bouchard RA, Clark RB, Giles WR. Role of sodium-calcium exchange in activation of contraction in rat ventricle. Journal of Physiology. 1993;472:391–413. - PMC - PubMed

Publication types