Comparative Study
. 2001 Oct 15;103(3):216-22.

Decreased bone mineral density in Prader-Willi syndrome: comparison with obese subjects

Affiliations
Comparative Study

Decreased bone mineral density in Prader-Willi syndrome: comparison with obese subjects

M G Butler et al. Am J Med Genet. .

Abstract

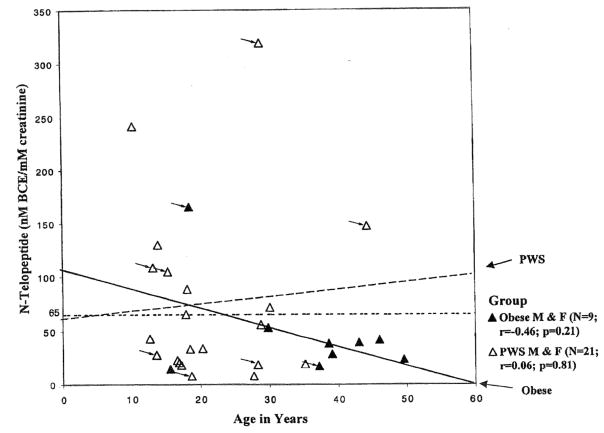
Bone density, anthropometric data, and markers of bone turnover were collected on 21 subjects diagnosed with Prader-Willi syndrome (PWS) and compared with 9 subjects with obesity of unknown cause. In addition, urinary N-telopeptide levels were obtained in all subjects. N-telopeptides are the peptide fragments of type I collagen, the major bone matrix material. During periods of active bone degradation or high bone turnover, high levels of N-telopeptides are excreted in the urine. However, no significant difference was detected in the urinary N-telopeptide levels when corrected for creatinine excretion (raw or transformed data) between our subjects with obesity or PWS and the observed effect size of the between-group difference was small. Although N-telopeptide levels were higher but not significantly different in the subjects with PWS compared with obese controls, the subjects with PWS had significantly decreased total bone and spine mineral density and total bone mineral content (all P < 0.001). No differences in N-telopeptide levels or bone mineral density were observed between subjects with PWS and chromosome 15q deletion or maternal disomy. Thus, decreased bone mineral density in subjects with PWS may relate to the lack of depositing bone mineral during growth when bones are becoming more dense (e.g., during adolescence), possibly because of decreased production of sex or growth hormones and/or long-standing hypotonia. It may not be caused by loss, or active degradation, of bone matrix measurable by the methods described in this study further supporting the possible need for hormone therapy during adolescence.


Figures

Fig. 1
Fig. 1
Scatterplot data from obese (2 males; 7 females) and Prader-Willi syndrome (7 males; 14 females) subjects showing age in years and body mass index (BMI). Obesity was defined as BMI ≥ 27 for subjects older than or equal to 15 years of age and ≥ 23 for ages 10–14 years [Butler et al., 1998] as represented on the scatterplot by the small broken lines. The number of subjects, correlations, and P values are presented for each subject group. Arrows by symbols represent males in each group.
Fig. 2
Fig. 2
Scatterplot data from obese (2 males; 7 females) and Prader-Willi syndrome (7 males; 14 females) subjects showing age in years and total percent fat. The number of subjects, correlations, and P values are presented for each subject group. All subjects were in the obese range (greater than 35% body fat) excluding one 46-year-old female judged to have regional obesity with 35% fat in her lower extremities identified by dual-energy X-ray absorptiometry (DEXA). Arrows by symbols represent males in each group.
Fig. 3
Fig. 3
Scatterplot data from obese (2 males; 7 females) and Prader-Willi syndrome (7 males; 14 females) subjects showing age in years and total bone mineral density. A representative upper and lower range for bone mineral density from premenopausal women is designated by the upper and lower small broken lines. The number of subjects, correlations, and P values are presented for each subject group. Arrows by symbols represent males in each group.
Fig. 4
Fig. 4
Scatterplot data from obese (2 males; 7 females) and Prader-Willi syndrome (7 males; 14 females) subjects showing age in years and spine bone mineral density. The number of subjects, correlations, and P values are presented for each subject group. Arrows by symbols represent males in each group.
Fig. 5
Fig. 5
Scatterplot data from obese (2 males; 7 females) and Prader-Willi syndrome (PWS) (7 males; 14 females) subjects showing age in years and N-telopeptide levels. The number of subjects, correlations, and P values are presented for each subject group. Upper limit of normal (+2 SD) for N-telopeptides of 65 nmol bone collagen equivalent (BCE)/mmol creatinine in premenopausal women is represented by the small broken line. Levels for males are generally lower. N-telopeptide levels for eight PWS subjects (3 males; 5 females) and one obese male were above this upper limit representing high levels. An N-telopeptide value of 67 or greater is associated with significant risk of bone loss as measured by bone mineral density. The relative risk for bone less for values greater than 67 is 17.3 (personal communication, Osteomark, Seattle, WA). Arrows by symbols represent males in each group.

References

    1. Borenstein M, Rothstein H, Cohen J. Power and precision. Teaneck, NJ: Biostat; 1997.
    1. Butler MG. Prader-Willi syndrome: Current understanding of cause and diagnosis. Am J Med Genet. 1990;35:319–332. - PMC - PubMed
    1. Butler MG, Thompson T. Prader-Willi syndrome: Clinical and genetic findings. The Endocrinologist. 2000;10(Suppl):3S–16S. - PMC - PubMed
    1. Butler MG, Meaney FJ, Palmer CG. Clinical and cytogenetic survey of 39 individuals with the Prader-Labhart-Willi syndrome. Am J Med Genet. 1986;23:793–809. - PMC - PubMed
    1. Butler MG, Hedges L, Hovis CL, Feurer ID. Genetic variants of the human obesity (OB) gene in subjects with and without Prader-Willi syndrome: comparison with body mass index and weight. Clin Genet. 1998;54:385–393. - PMC - PubMed

Publication types

MeSH terms