

Central importance of immunoglobulin A in host defense against Giardia spp
- PMID: 11748158
- PMCID: PMC127595
- DOI: 10.1128/IAI.70.1.11-18.2002
Central importance of immunoglobulin A in host defense against Giardia spp
Abstract
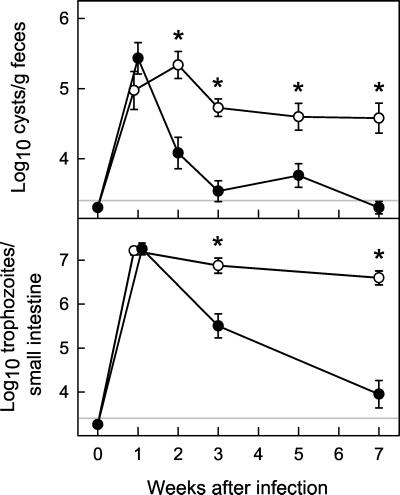
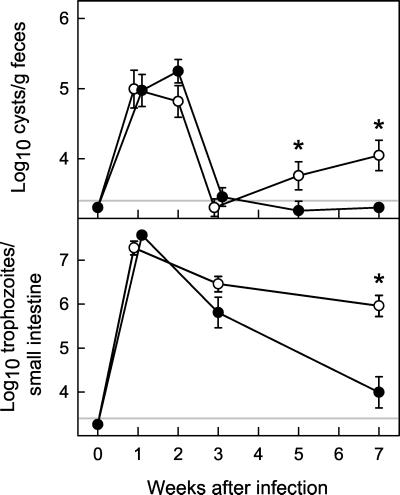
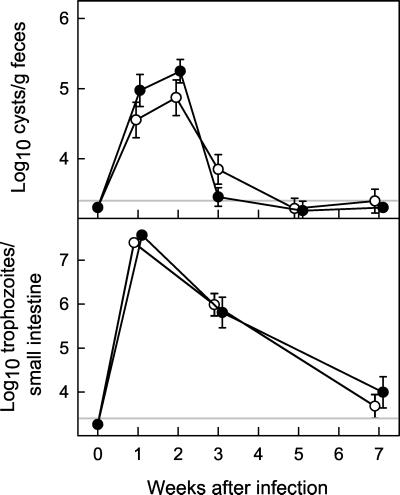
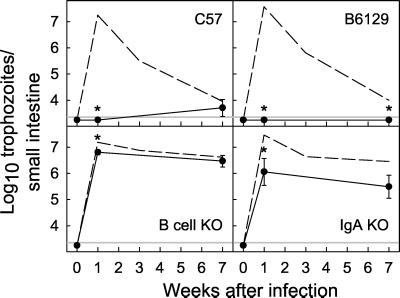
The protozoan pathogen Giardia is an important cause of parasitic diarrheal disease worldwide. It colonizes the lumen of the small intestine, suggesting that effective host defenses must act luminally. Immunoglobulin A (IgA) antibodies are presumed to be important for controlling Giardia infection, but direct evidence for this function is lacking. B-cell-independent effector mechanisms also exist and may be equally important for antigiardial host defense. To determine the importance of the immunoglobulin isotypes that are transported into the intestinal lumen, IgA and IgM, for antigiardial host defense, we infected gene-targeted mice lacking IgA-expressing B-cells, IgM-secreting B-cells, or all B-cells as controls with Giardia muris or Giardia lamblia GS/M-83-H7. We found that IgA-deficient mice could not eradicate either G. muris or G. lamblia infection, demonstrating that IgA is required for their clearance. Furthermore, although neither B-cell-deficient nor IgA-deficient mice could clear G. muris infections, IgA-deficient mice controlled infection significantly better than B-cell-deficient mice, suggesting the existence of B-cell-dependent but IgA-independent antigiardial defenses. In contrast, mice deficient for secreted IgM antibodies cleared G. muris infection normally, indicating that they have no unique functions in antigiardial host defense. These data, together with the finding that B-cell-deficient mice have some, albeit limited, residual capacity to control G. muris infection, show that IgA-dependent host defenses are central for eradicating Giardia spp. Moreover, B-cell-dependent but IgA-independent and B-cell-independent antigiardial host defenses exist but are less important for controlling infection.
Figures
Similar articles
-
Immunological aspects of Giardia infections.Parasite. 2014;21:55. doi: 10.1051/parasite/2014056. Epub 2014 Oct 28. Parasite. 2014. PMID: 25347704 Free PMC article. Review.
-
IL-17A promotes protective IgA responses and expression of other potential effectors against the lumen-dwelling enteric parasite Giardia.Exp Parasitol. 2015 Sep;156:68-78. doi: 10.1016/j.exppara.2015.06.003. Epub 2015 Jun 9. Exp Parasitol. 2015. PMID: 26071205 Free PMC article.
-
Eosinophils are dispensable for the regulation of IgA and Th17 responses in Giardia muris infection.Parasite Immunol. 2021 Mar;43(3):e12791. doi: 10.1111/pim.12791. Epub 2020 Sep 23. Parasite Immunol. 2021. PMID: 32918307
-
Giardia lamblia infections in B-cell-deficient transgenic mice.Infect Immun. 1997 Sep;65(9):3944-6. doi: 10.1128/iai.65.9.3944-3946.1997. Infect Immun. 1997. PMID: 9284176 Free PMC article.
-
Microbes and microbial toxins: paradigms for microbial-mucosal interactions I. Pathophysiological aspects of enteric infections with the lumen-dwelling protozoan pathogen Giardia lamblia.Am J Physiol Gastrointest Liver Physiol. 2001 Jan;280(1):G1-6. doi: 10.1152/ajpgi.2001.280.1.G1. Am J Physiol Gastrointest Liver Physiol. 2001. PMID: 11123191 Review.
Cited by
-
Immunophenotyping in post-giardiasis functional gastrointestinal disease and chronic fatigue syndrome.BMC Infect Dis. 2012 Oct 14;12:258. doi: 10.1186/1471-2334-12-258. BMC Infect Dis. 2012. PMID: 23061432 Free PMC article.
-
Immunological aspects of Giardia infections.Parasite. 2014;21:55. doi: 10.1051/parasite/2014056. Epub 2014 Oct 28. Parasite. 2014. PMID: 25347704 Free PMC article. Review.
-
Antibody and cytokine responses to Giardia excretory/secretory proteins in Giardia intestinalis-infected BALB/c mice.Parasitol Res. 2014 Jul;113(7):2709-18. doi: 10.1007/s00436-014-3927-4. Epub 2014 May 28. Parasitol Res. 2014. PMID: 24867815
-
Interleukin-17 receptor A (IL-17RA) as a central regulator of the protective immune response against Giardia.Sci Rep. 2017 Aug 17;7(1):8520. doi: 10.1038/s41598-017-08590-x. Sci Rep. 2017. PMID: 28819174 Free PMC article.
-
The Intersection of Immune Responses, Microbiota, and Pathogenesis in Giardiasis.Trends Parasitol. 2017 Nov;33(11):901-913. doi: 10.1016/j.pt.2017.08.001. Epub 2017 Aug 19. Trends Parasitol. 2017. PMID: 28830665 Free PMC article. Review.
References
-
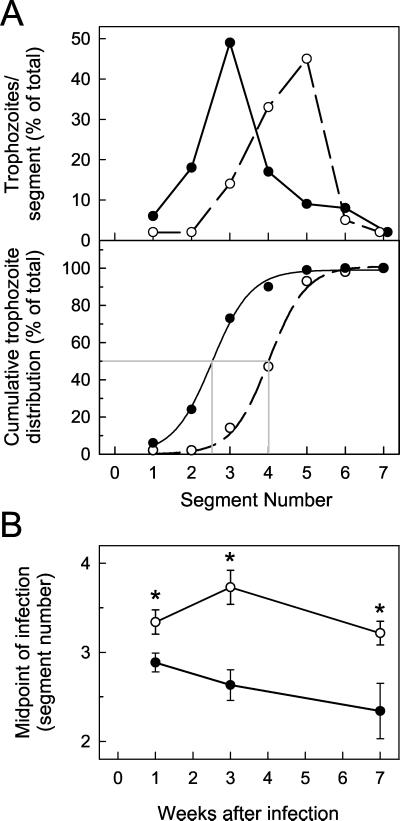
- Belosevic, M., and G. M. Faubert. 1983. Giardia muris: correlation between oral dosage, course of infection, and trophozoite distribution in the mouse small intestine. Exp. Parasitol. 56: 93–100. - PubMed
Publication types
MeSH terms
Substances
Grants and funding
LinkOut - more resources
Full Text Sources
Other Literature Sources
Medical
Molecular Biology Databases
Miscellaneous
