Interleukin-2 and loss of immunity in experimental Mycobacterium avium infection
- PMID: 11748160
- PMCID: PMC127607
- DOI: 10.1128/IAI.70.1.27-35.2002
Interleukin-2 and loss of immunity in experimental Mycobacterium avium infection
Abstract
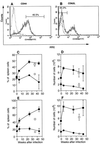
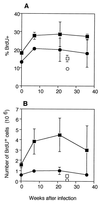
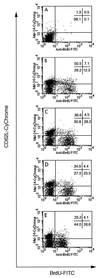
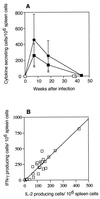
Experimental infection of mice with a virulent strain of Mycobacterium avium leads to a slowly progressive disease, which we have previously shown culminates in loss of gamma interferon (IFN-gamma) production by T lymphocytes and death of the animals approximately 40 weeks after infection. Here we investigated the changes in T-cell activation, the production of interleukin-2 (IL-2), and the response to IL-2 throughout M. avium infection as a possible explanation for this loss. We found that there is a steady increase in the percentage of T cells expressing activation markers right to the end of infection. However, in vivo T-cell proliferation, measured as a percentage of CD4(+) and CD8(+) cells incorporating 5-bromo-2'-deoxyuridine, initially increased but then remained constant. In the final stages of infection there was a decline in proliferation of activated (CD62L(-)) T cells. Since IL-2 is a major driver of T-cell proliferation, we asked whether this was due to loss of IL-2 responsiveness or production. However, CD25 (IL-2Ralpha) continued to be highly expressed in the terminal stages of infection, and although IL-2 production declined, addition of recombinant IL-2 to cultures could not rescue the final loss of IFN-gamma production.
Figures


Similar articles
-
CD4+ T cells but Not CD8+ or gammadelta+ lymphocytes are required for host protection against Mycobacterium avium infection and dissemination through the intestinal route.Infect Immun. 2005 May;73(5):2621-7. doi: 10.1128/IAI.73.5.2621-2627.2005. Infect Immun. 2005. PMID: 15845464 Free PMC article.
-
Generalized immunological decline during long-term experimental infection with Mycobacterium avium.Infect Immun. 2002 Dec;70(12):7145-8. doi: 10.1128/IAI.70.12.7145-7148.2002. Infect Immun. 2002. PMID: 12438398 Free PMC article.
-
Interleukin-6 production during chronic experimental infection.Immunol Cell Biol. 1993 Aug;71 ( Pt 4):275-80. doi: 10.1038/icb.1993.32. Immunol Cell Biol. 1993. PMID: 8225396
-
Role of type I cytokines in host defense against Mycobacterium avium infection.Curr Pharm Des. 2003;9(1):61-5. doi: 10.2174/1381612033392369. Curr Pharm Des. 2003. PMID: 12570675 Review.
-
Clinical and immunologic features of an atypical intracranial mycobacterium avium complex (MAC) infection compared with those of pulmonary MAC infections.Clin Vaccine Immunol. 2008 Oct;15(10):1580-9. doi: 10.1128/CVI.00173-08. Epub 2008 Aug 13. Clin Vaccine Immunol. 2008. PMID: 18701648 Free PMC article. Review.
Cited by
-
Transient inhibition of Th1-type cytokine production by CD4 T cells in hepatitis B core antigen immunized mice is mediated by regulatory T cells.Immunology. 2006 Aug;118(4):438-48. doi: 10.1111/j.1365-2567.2006.02397.x. Epub 2006 Jun 6. Immunology. 2006. PMID: 16762029 Free PMC article.
-
Gamma interferon-induced T-cell loss in virulent Mycobacterium avium infection.Infect Immun. 2005 Jun;73(6):3577-86. doi: 10.1128/IAI.73.6.3577-3586.2005. Infect Immun. 2005. PMID: 15908387 Free PMC article.
-
Responses of Bovine Innate Immunity to Mycobacterium avium subsp. paratuberculosis Infection Revealed by Changes in Gene Expression and Levels of MicroRNA.PLoS One. 2016 Oct 19;11(10):e0164461. doi: 10.1371/journal.pone.0164461. eCollection 2016. PLoS One. 2016. PMID: 27760169 Free PMC article.
-
The alteration of lymphocyte subsets in idiopathic granulomatous mastitis.Turk J Med Sci. 2021 Aug 30;51(4):1905-1911. doi: 10.3906/sag-2012-192. Turk J Med Sci. 2021. PMID: 33862673 Free PMC article.
-
CD4 T cells producing IFN-gamma in the lungs of mice challenged with mycobacteria express a CD27-negative phenotype.Clin Exp Immunol. 2004 Oct;138(1):21-9. doi: 10.1111/j.1365-2249.2004.02573.x. Clin Exp Immunol. 2004. PMID: 15373901 Free PMC article.
References
-
- Appelberg, R. 1996. Immune response to atypical mycobacteria. Res. Immunol. 147: 560–564. - PubMed
-
- Bancroft, G. J. 1993. The role of natural killer cells in innate resistance to infection. Curr. Opin. Immunol. 5: 503–510. - PubMed
-
- Boyle, W. 1968. An extension of the 51Cr release assay for the estimation of mouse cytotoxins. Transplantation 6: 761–764. - PubMed
-
- Brozna, J. P., M. Horan, J. M. Rademacher, K. M. Pabst, and M. J. Pabst. 1991. Monocyte responses to sulfatide from Mycobacterium tuberculosis: inhibition of priming for enhanced release of superoxide, associated with increased secretion of interleukin-1 and tumor necrosis factor alpha, and altered protein phosphorylation. Infect. Immun. 59: 2542–2548. - PMC - PubMed
Publication types
MeSH terms
Substances
LinkOut - more resources
Full Text Sources
Research Materials

