

Central role for interleukin-4 in regulating nitric oxide-mediated inhibition of T-cell proliferation and gamma interferon production in schistosomiasis
- PMID: 11748180
- PMCID: PMC127598
- DOI: 10.1128/IAI.70.1.177-184.2002
Central role for interleukin-4 in regulating nitric oxide-mediated inhibition of T-cell proliferation and gamma interferon production in schistosomiasis
Abstract
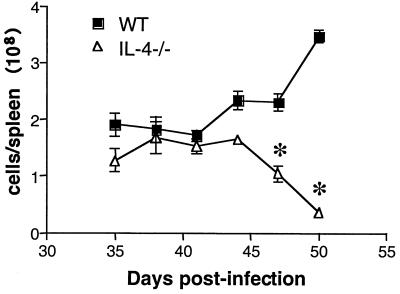
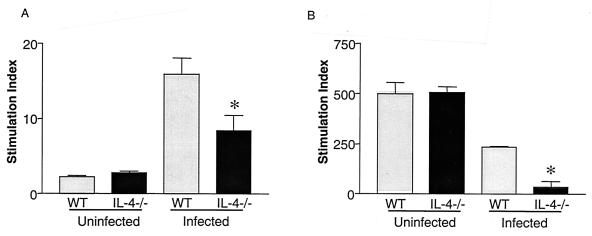
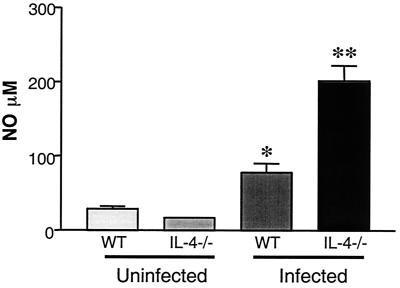
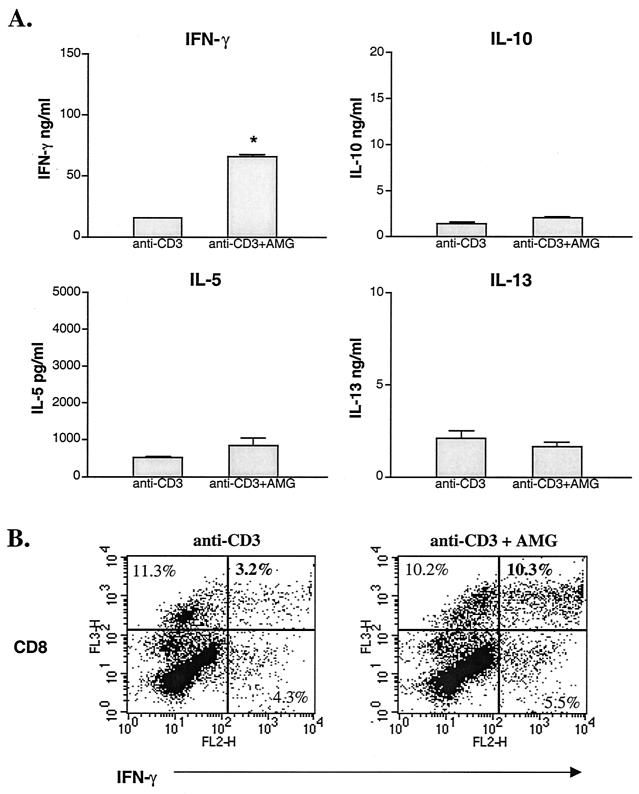
Schistosoma mansoni-infected wild-type (WT) mice develop a Th2 response and chronic disease. In contrast, infected interleukin-4 double-deficient (IL-4(-/-)) mice develop a Th1-like response and an acute, lethal syndrome. Disease severity in these animals correlates with excessive and prolonged production of nitric oxide (NO) associated with enhanced antigen-driven gamma interferon (IFN-gamma) production in the absence of IL-4. Strikingly, splenic lymphocytes from infected IL-4(-/-) mice failed to proliferate as well as those from infected WT mice following stimulation in vitro with antigen or anti-CD3 antibody. Contrary to antigen-driven IFN-gamma responses, anti-CD3 antibody stimulation of splenocytes resulted in significantly less IFN-gamma being produced by CD8 cells from infected IL-4(-/-) mice than by those from infected WT mice or normal mice. NO is largely responsible for the impaired T-cell functions in infected IL-4(-/-) mice, as inhibition of iNOS significantly enhanced proliferation and IFN-gamma production.
Figures


Similar articles
-
Role of gamma interferon in the pathogenesis of severe schistosomiasis in interleukin-4-deficient mice.Infect Immun. 2001 Dec;69(12):7445-52. doi: 10.1128/IAI.69.12.7445-7452.2001. Infect Immun. 2001. PMID: 11705919 Free PMC article.
-
Type 1 CD8+ T cell responses during infection with the helminth Schistosoma mansoni.J Immunol. 1996 Oct 1;157(7):3046-53. J Immunol. 1996. PMID: 8816414
-
Patterns of cytokine production and proliferation by T lymphocytes differ in mice vaccinated or infected with Schistosoma mansoni.Immunology. 1991 Jul;73(3):327-33. Immunology. 1991. PMID: 1908821 Free PMC article.
-
Schistosoma mansoni infection induces a type 1 CD8+ cell response.Behring Inst Mitt. 1997 Mar;(99):79-84. Behring Inst Mitt. 1997. PMID: 9303205 Review.
-
The initiation and function of Th2 responses during infection with Schistosoma mansoni.Adv Exp Med Biol. 1998;452:67-73. doi: 10.1007/978-1-4615-5355-7_9. Adv Exp Med Biol. 1998. PMID: 9889961 Review.
Cited by
-
Cysteinyl leukotriene receptor-1 as a potential target for host-directed therapy during chronic schistosomiasis in murine model.Front Immunol. 2024 May 22;15:1279043. doi: 10.3389/fimmu.2024.1279043. eCollection 2024. Front Immunol. 2024. PMID: 38840916 Free PMC article.
-
Modulation of innate antigen-presenting cell function by pre-patent schistosome infection.PLoS Negl Trop Dis. 2013;7(3):e2136. doi: 10.1371/journal.pntd.0002136. Epub 2013 Mar 21. PLoS Negl Trop Dis. 2013. PMID: 23556020 Free PMC article.
-
Innate Immune Response to Helminth Infections.Adv Exp Med Biol. 2025;1476:251-273. doi: 10.1007/978-3-031-85340-1_10. Adv Exp Med Biol. 2025. PMID: 40622546 Review.
-
Dynamics of Host Immune Response Development During Schistosoma mansoni Infection.Front Immunol. 2022 Jul 8;13:906338. doi: 10.3389/fimmu.2022.906338. eCollection 2022. Front Immunol. 2022. PMID: 35958580 Free PMC article.
-
Overexpression of interleukin-4 in lungs of mice impairs elimination of Histoplasma capsulatum.Infect Immun. 2003 Jul;71(7):3787-93. doi: 10.1128/IAI.71.7.3787-3793.2003. Infect Immun. 2003. PMID: 12819061 Free PMC article.
References
-
- al-Ramadi, B. K., J. J. Meissler, D. Huang, and T. K. Eisenstein. 1992. Immunosuppression induced by nitric oxide and its inhibition by interleukin-4. Eur. J. Immunol. 22: 2249–2254. - PubMed
-
- Albina, J. E., J. A. Abate, and W. L. Henry. 1991. Nitric oxide production is required for murine resident peritoneal macrophages to suppress mitogen-stimulated T cell proliferation. Role of IFN-gamma in the induction of the nitric oxide-synthesizing pathway. J. Immunol. 147: 144–148. - PubMed
-
- Allione, A., P. Bernabei, M. Bosticardo, S. Ariotti, G. Forni, and F. Novelli. 1999. Nitric oxide suppresses human T lymphocyte proliferation through IFN-gamma-dependent and IFN-gamma-independent induction of apoptosis. J. Immunol. 163: 4182–4191. - PubMed
-
- Amiri, P., R. M. Locksley, T. G. Parslow, M. Sadick, E. Rector, D. Ritter, and J. H. McKerrow. 1992. Tumor necrosis factor alpha restores granulomas and induces parasite egg-laying in schistosome-infected SCID mice. Nature 356: 604–607. - PubMed
-
- Angulo, I., F. G. de las Heras, J. F. Garcia-Bustos, D. Gargallo, M. A. Munoz-Fernandez, and M. Fresno. 2000. Nitric oxide-producing CD11b(+)Ly-6G(Gr-1)(+)CD31(ER-MP12)(+) cells in the spleen of cyclophosphamide-treated mice: implications for T-cell responses in immunosuppressed mice. Blood 95: 212–220. - PubMed
Publication types
MeSH terms
Substances
Grants and funding
LinkOut - more resources
Full Text Sources
Molecular Biology Databases
Research Materials
