

A regulatory cascade involving retinoic acid, Cbfa1, and matrix metalloproteinases is coupled to the development of a process of perichondrial invasion and osteogenic differentiation during bone formation
- PMID: 11748248
- PMCID: PMC2199331
- DOI: 10.1083/jcb.200106147
A regulatory cascade involving retinoic acid, Cbfa1, and matrix metalloproteinases is coupled to the development of a process of perichondrial invasion and osteogenic differentiation during bone formation
Abstract
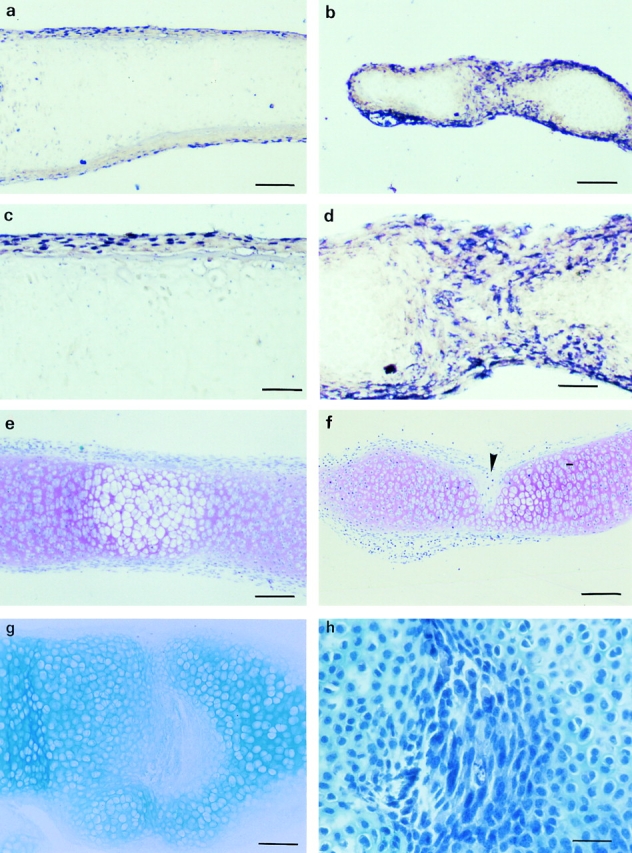
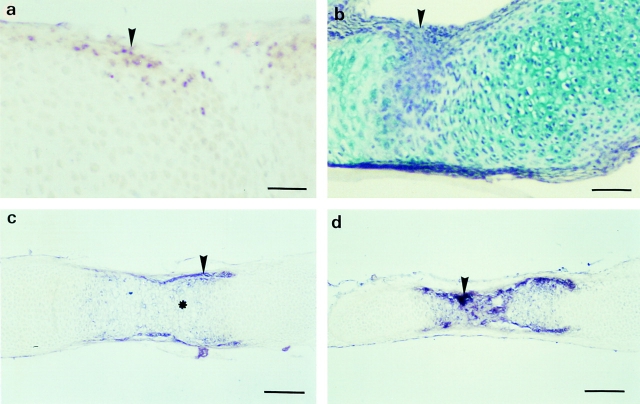
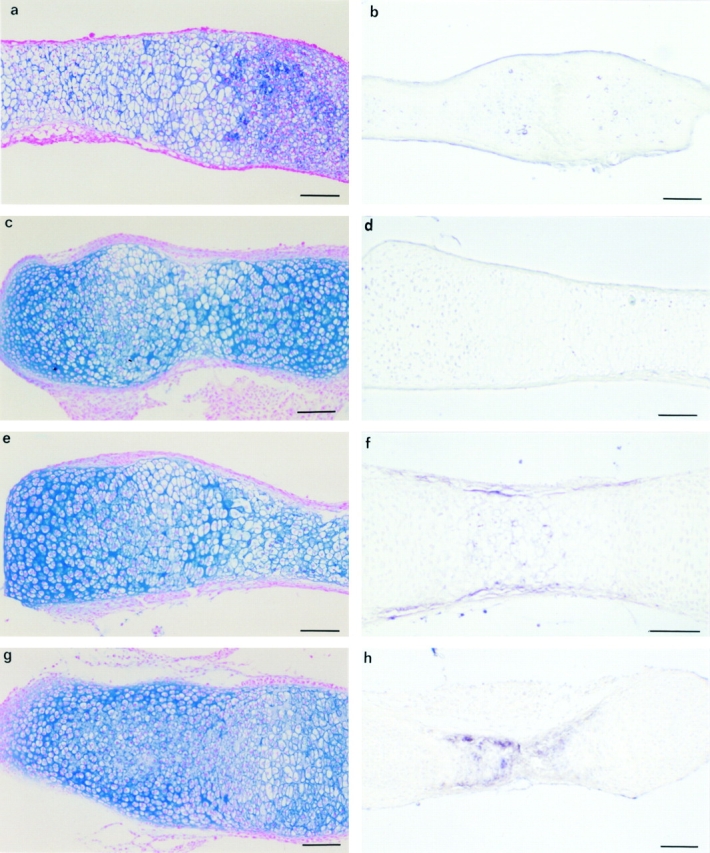
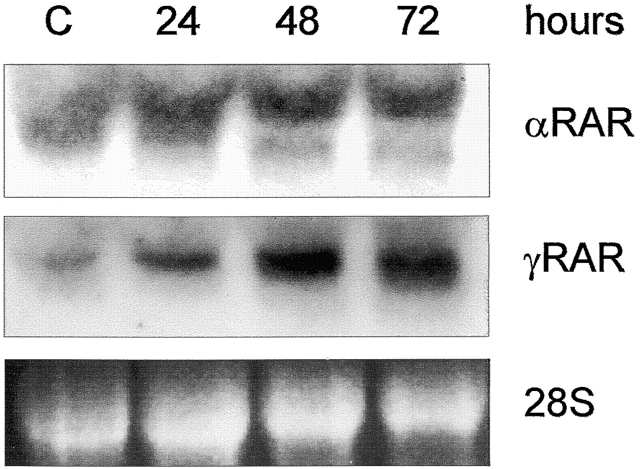
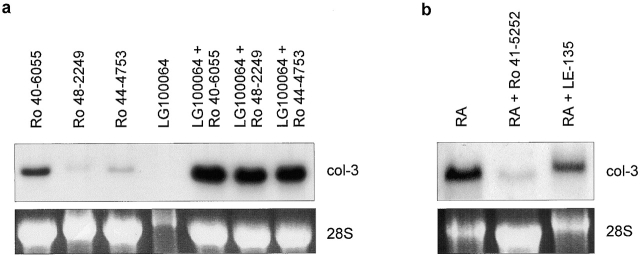
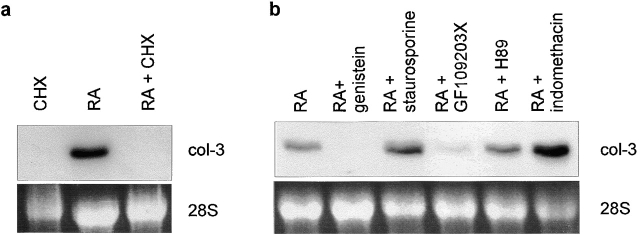
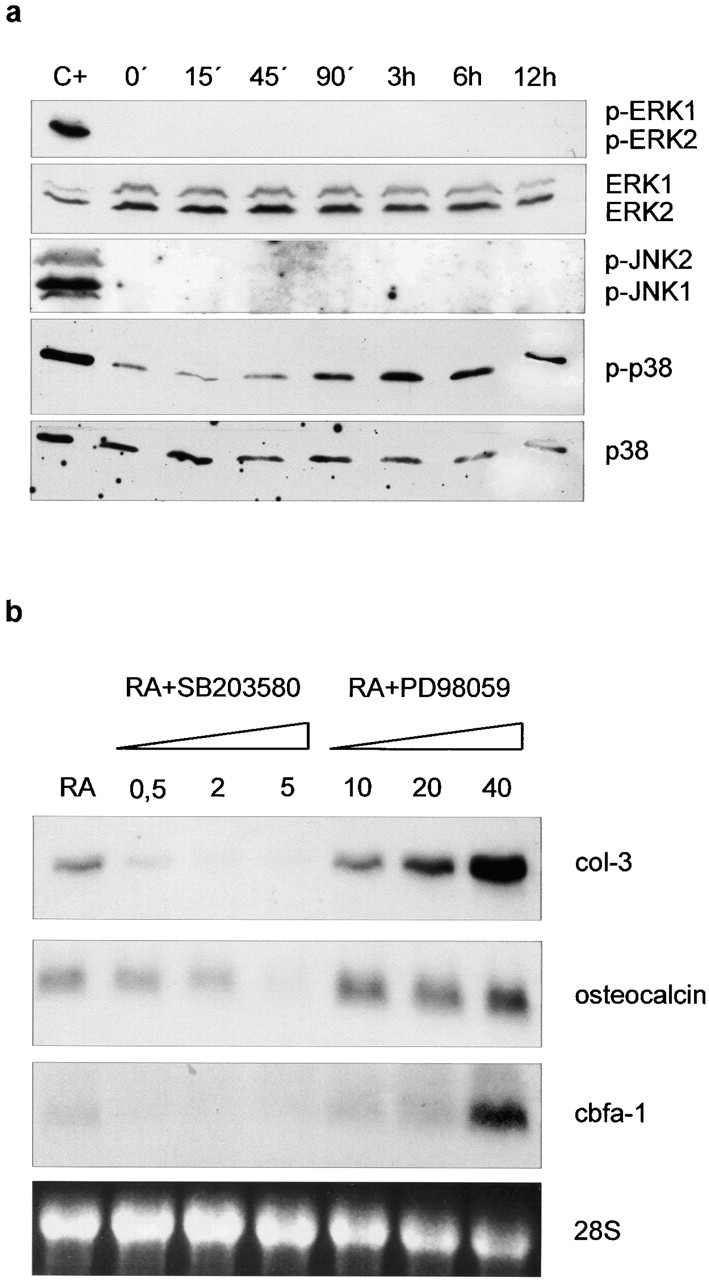
Tissue-remodeling processes are largely mediated by members of the matrix metalloproteinase (MMP) family of endopeptidases whose expression is strictly controlled both spatially and temporally. In this article, we have examined the molecular mechanisms that could contribute to modulate the expression of MMPs like collagenase-3 and MT1-MMP during bone formation. We have found that all-trans retinoic acid (RA), which usually downregulates MMPs, strongly induces collagenase-3 expression in cultures of embryonic metatarsal cartilage rudiments and in chondrocytic cells. This effect is dose and time dependent, requires the de novo synthesis of proteins, and is mediated by RAR-RXR heterodimers. Analysis of the signal transduction mechanisms underlying the upregulating effect of RA on collagenase-3 expression demonstrated that this factor acts through a signaling pathway involving p38 mitogen-activated protein kinase. RA treatment of chondrocytic cells also induces the production of MT1-MMP, a membrane-bound metalloproteinase essential for skeletal formation, which participates in a proteolytic cascade with collagenase-3. The production of these MMPs is concomitant with the development of an RA-induced differentiation program characterized by formation of a mineralized bone matrix, downregulation of chondrocyte markers like type II collagen, and upregulation of osteoblastic markers such as osteocalcin. These effects are attenuated in metatarsal rudiments in which RA induces the invasion of perichondrial osteogenic cells from the perichondrium into the cartilage rudiment. RA treatment also resulted in the upregulation of Cbfa1, a transcription factor responsible for collagenase-3 and osteocalcin induction in osteoblastic cells. The dynamics of Cbfa1, MMPs, and osteocalcin expression is consistent with the fact that these genes could be part of a regulatory cascade initiated by RA and leading to the induction of Cbfa1, which in turn would upregulate the expression of some of their target genes like collagenase-3 and osteocalcin.
Figures

Similar articles
-
Effects of retinoic acid on the differentiation of chondrogenic progenitor cells, ATDC5.J Med Dent Sci. 2005 Sep;52(3):153-62. J Med Dent Sci. 2005. PMID: 16350840
-
Interleukin-1 induction of collagenase 3 (matrix metalloproteinase 13) gene expression in chondrocytes requires p38, c-Jun N-terminal kinase, and nuclear factor kappaB: differential regulation of collagenase 1 and collagenase 3.Arthritis Rheum. 2000 Apr;43(4):801-11. doi: 10.1002/1529-0131(200004)43:4<801::AID-ANR10>3.0.CO;2-4. Arthritis Rheum. 2000. PMID: 10765924
-
Transcriptional induction of matrix metalloproteinase-13 (collagenase-3) by 1alpha,25-dihydroxyvitamin D3 in mouse osteoblastic MC3T3-E1 cells.J Bone Miner Res. 2001 Feb;16(2):221-30. doi: 10.1359/jbmr.2001.16.2.221. J Bone Miner Res. 2001. PMID: 11204422
-
Ets transcription factors and targets in osteogenesis.Oncogene. 2000 Dec 18;19(55):6455-63. doi: 10.1038/sj.onc.1204037. Oncogene. 2000. PMID: 11175361 Review.
-
Cbfa1: a molecular switch in osteoblast biology.Dev Dyn. 2000 Dec;219(4):461-71. doi: 10.1002/1097-0177(2000)9999:9999<::AID-DVDY1074>3.0.CO;2-C. Dev Dyn. 2000. PMID: 11084646 Review.
Cited by
-
Altered endochondral bone development in matrix metalloproteinase 13-deficient mice.Development. 2004 Dec;131(23):5883-95. doi: 10.1242/dev.01461. Development. 2004. PMID: 15539485 Free PMC article.
-
Hyaluronan oligosaccharide-induced activation of transcription factors in bovine articular chondrocytes.Arthritis Rheum. 2005 Mar;52(3):800-9. doi: 10.1002/art.20937. Arthritis Rheum. 2005. PMID: 15751080 Free PMC article.
-
Unravelling the molecular control of calvarial suture fusion in children with craniosynostosis.BMC Genomics. 2007 Dec 12;8:458. doi: 10.1186/1471-2164-8-458. BMC Genomics. 2007. PMID: 18076769 Free PMC article.
-
Generating cartilage repair from pluripotent stem cells.Tissue Eng Part B Rev. 2014 Aug;20(4):257-66. doi: 10.1089/ten.TEB.2012.0757. Epub 2013 Sep 24. Tissue Eng Part B Rev. 2014. PMID: 23957872 Free PMC article. Review.
-
Development and characterization of Xl1, a Xenopus laevis chondrocyte-like cell culture.Mol Cell Biochem. 2013 Jan;373(1-2):41-51. doi: 10.1007/s11010-012-1473-x. Epub 2012 Oct 10. Mol Cell Biochem. 2013. PMID: 23054192
References
-
- Alvarez, J., M. Balbín, F. Santos, M. Fernández, S. Ferrando, and J.M. López. 2000. Different bone growth rates are associated with changes in the expression pattern of types II and X collagens and collagenase 3 in proximal growth plates of the rat tibia. J. Bone Min. Res. 15:82–94. - PubMed
-
- Apte, S.S., M.F. Seldin, M. Hayashi, and B.R. Olsen. 1992. Cloning of the human and mouse type X collagen genes and mapping of the mouse type X collagen gene to chromosome 10. Eur. J. Biochem. 206:217–224. - PubMed
-
- Balbín, M., A. Fueyo, J.M. López, I. Díez-Itza, G. Velasco, and C. López-Otín. 1996. Expression of collagenase-3 in the rat ovary during the ovulatory process. J. Endocrinol. 149:405–415. - PubMed
-
- Balbín, M., A.M. Pendás, J.A. Uría, M.G. Jiménez, J.P. Freije, and C. López-Otín. 1999. Expression and regulation of collagenase-3 (MMP-13) in human malignant tumors. APMIS. 107:45–53. - PubMed
-
- Ballock, R.T., A. Heydemann, L.M. Wakefield, K.C. Flanders, A.B. Roberts, and M.B. Sporn. 1994. Inhibition of the chondrocyte phenotype by retinoic acid involves upregulation of metalloprotease genes independent of TGF-β. J. Cell Physiol. 159:340–346. - PubMed
