. 2001 Dec 17;194(12):1847-59.
doi: 10.1084/jem.194.12.1847.

Alphabeta T cell receptor-positive cells and interferon-gamma, but not inducible nitric oxide synthase, are critical for granuloma necrosis in a mouse model of mycobacteria-induced pulmonary immunopathology

Affiliations

Alphabeta T cell receptor-positive cells and interferon-gamma, but not inducible nitric oxide synthase, are critical for granuloma necrosis in a mouse model of mycobacteria-induced pulmonary immunopathology

S Ehlers et al. J Exp Med. .

Abstract

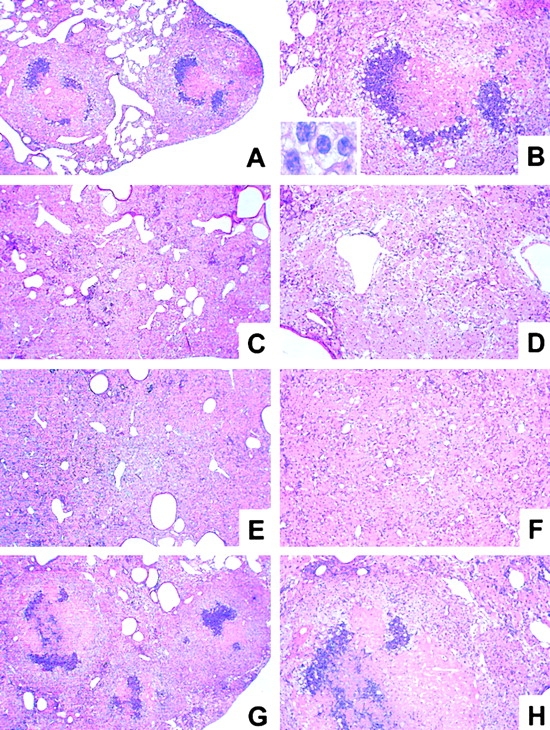
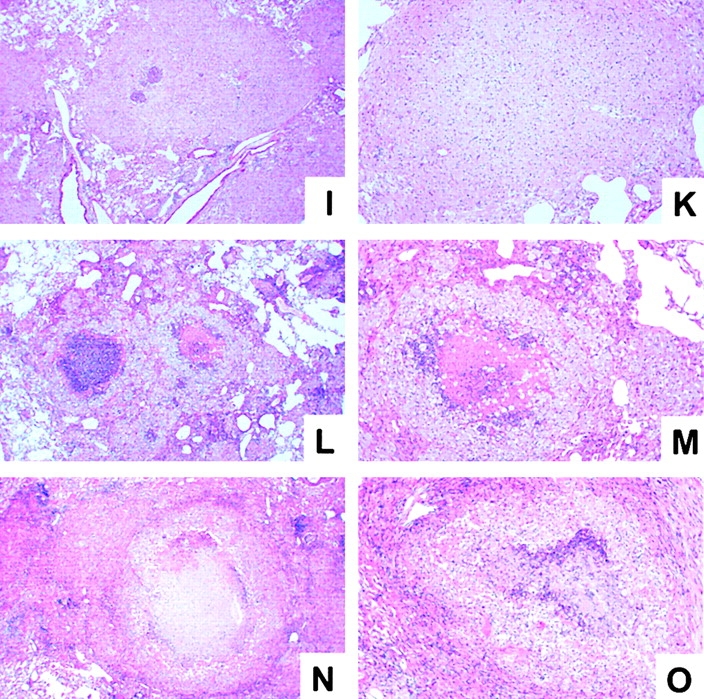
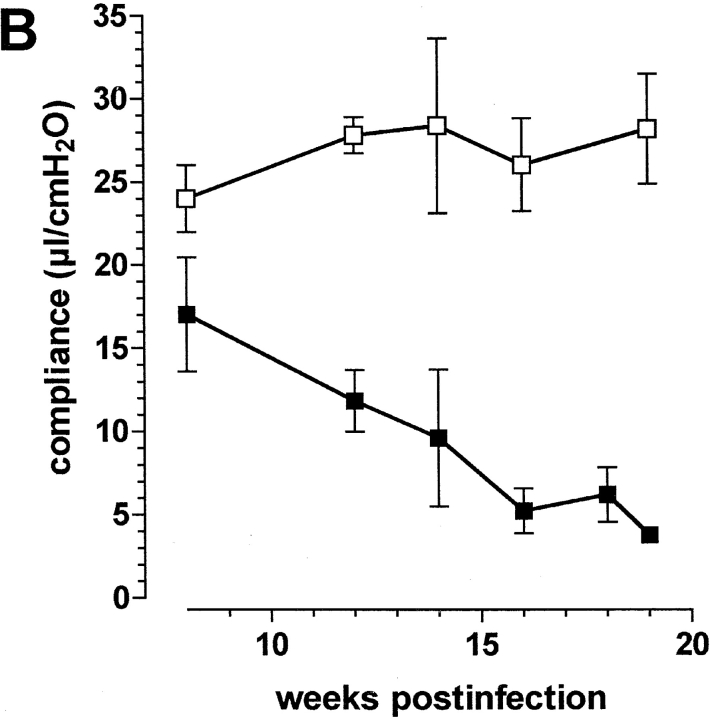
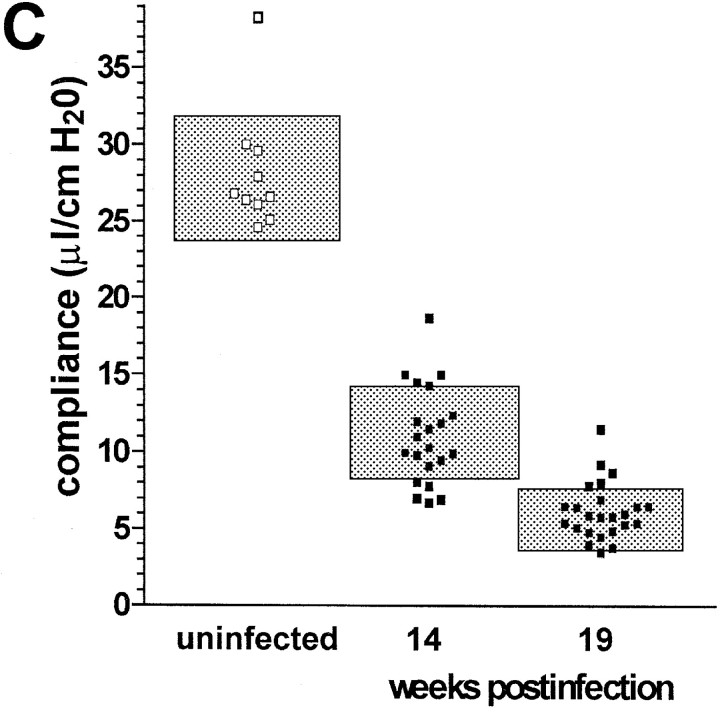
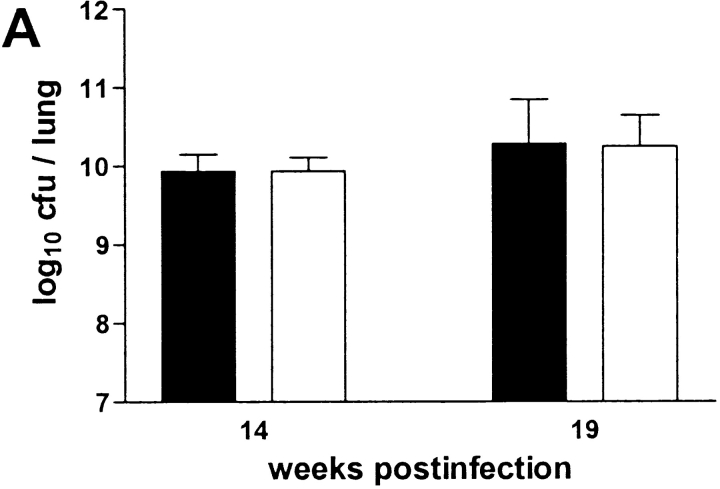
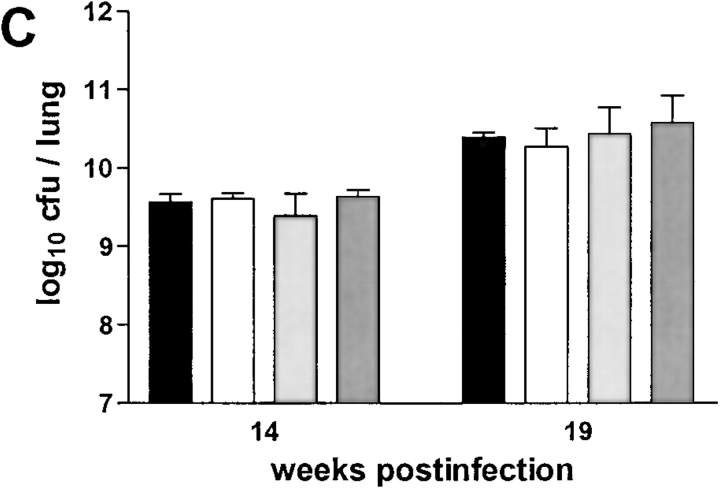
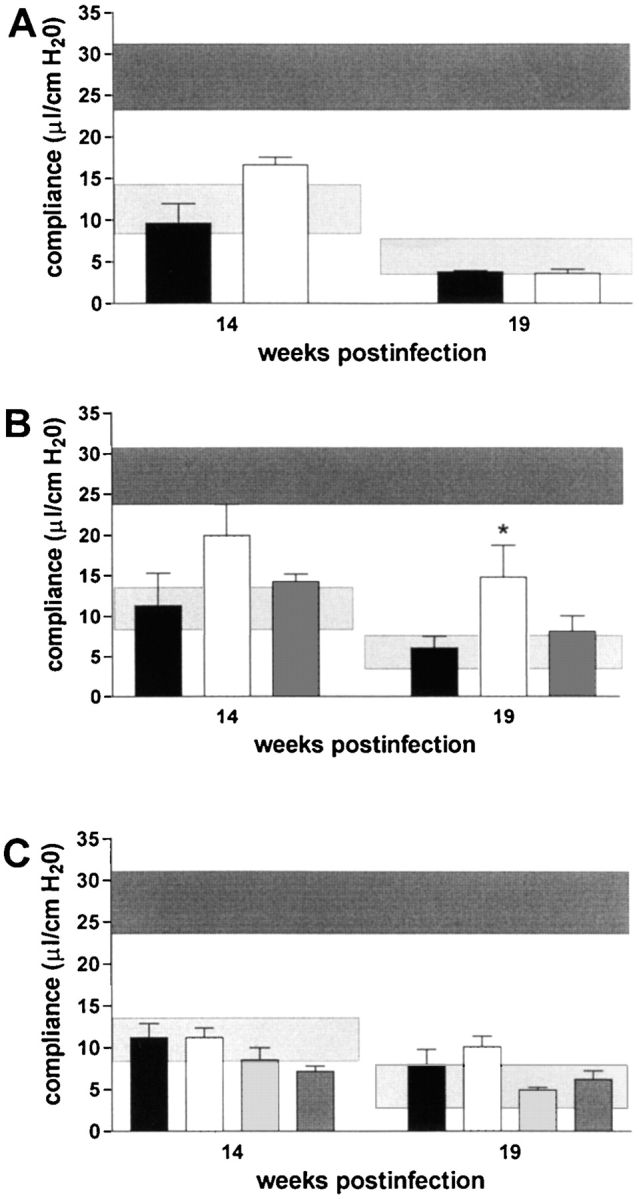
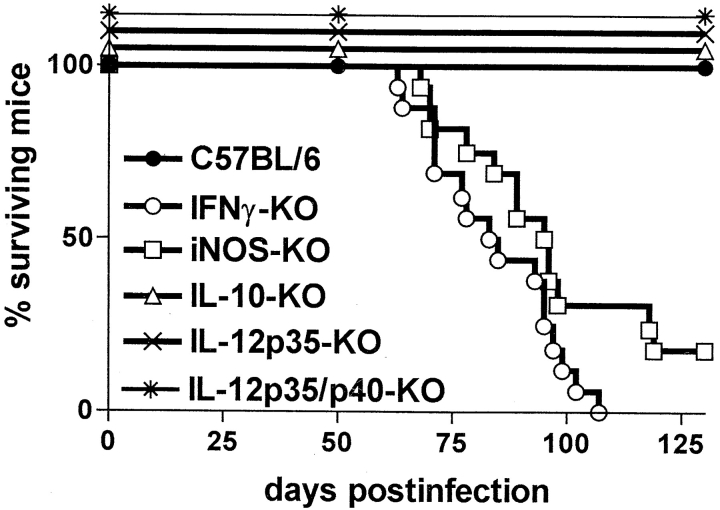
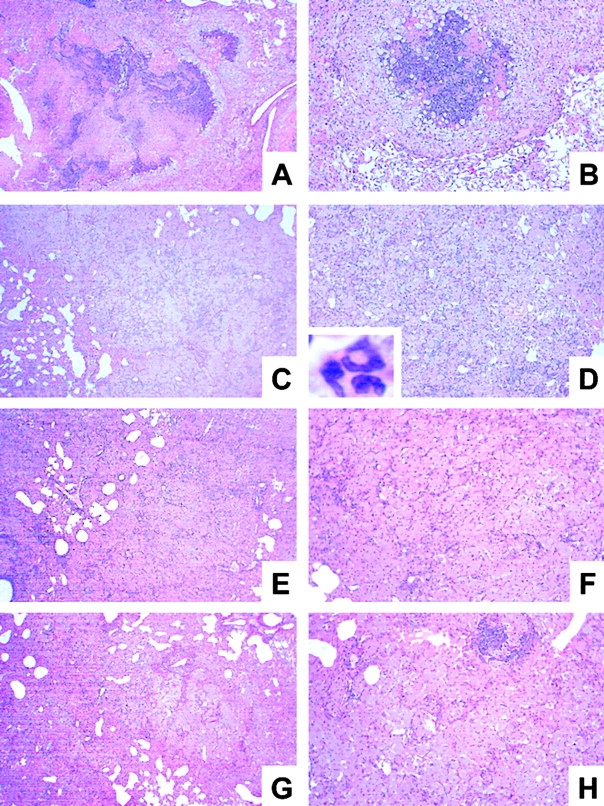
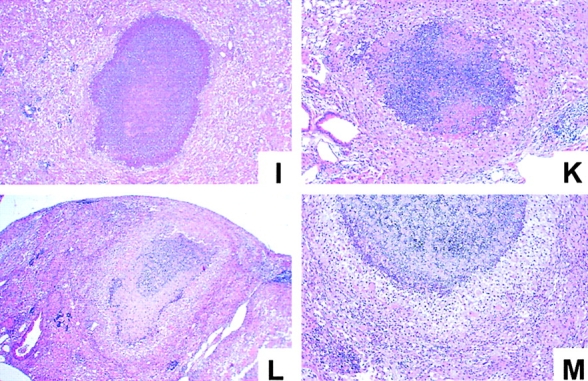
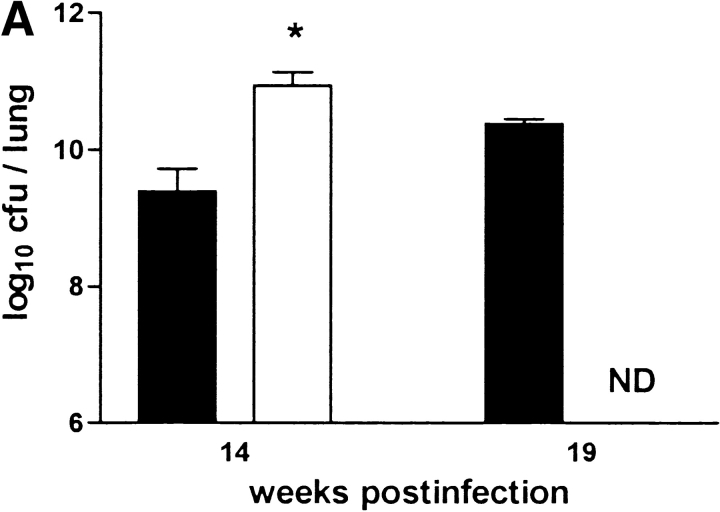
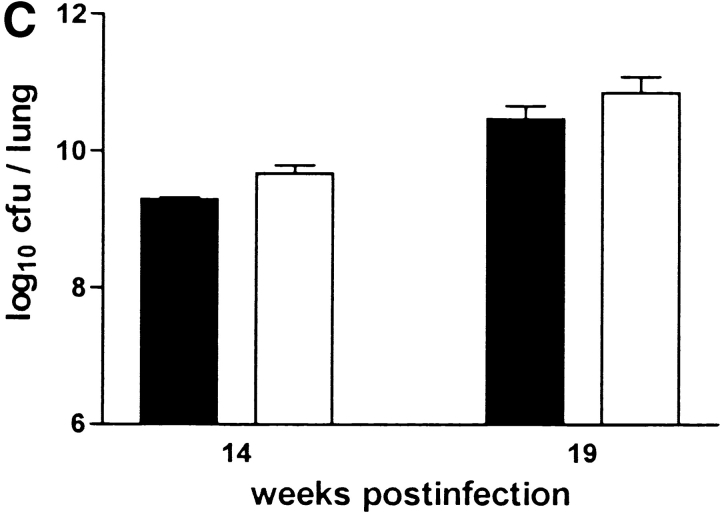
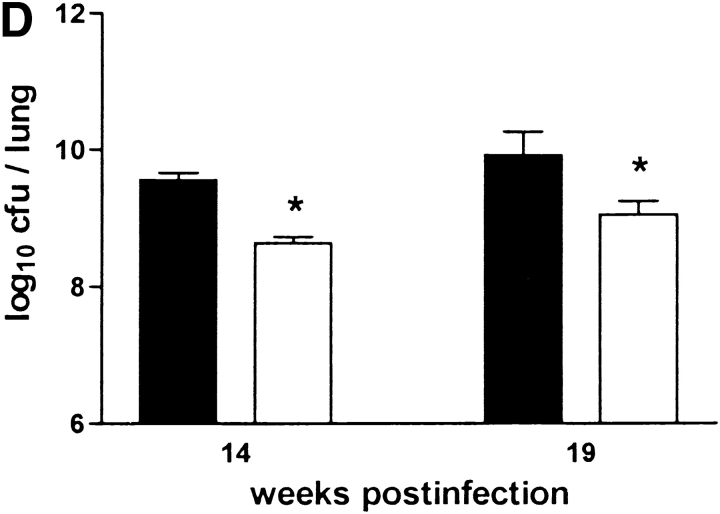
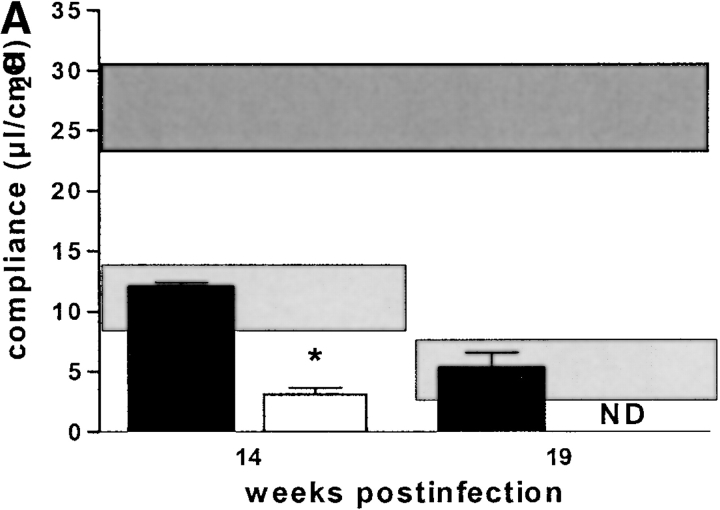
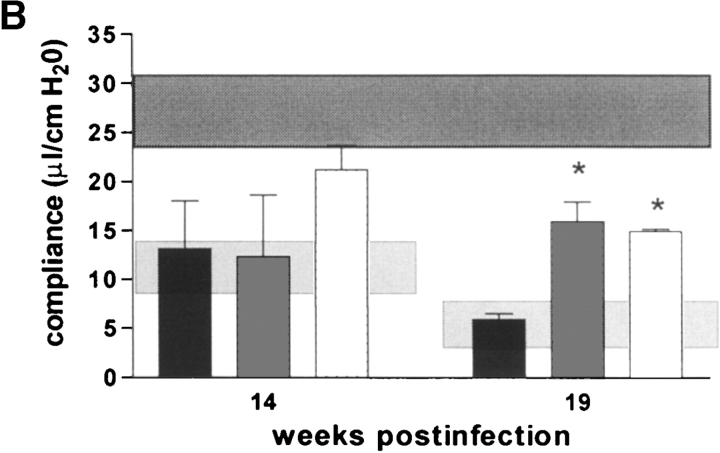
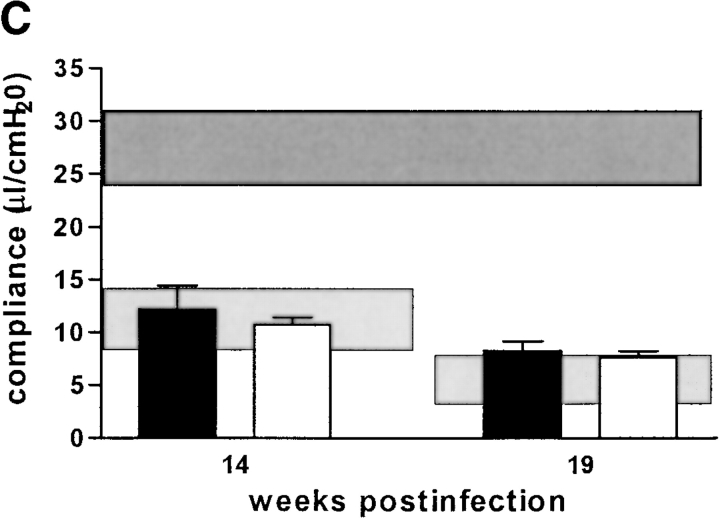
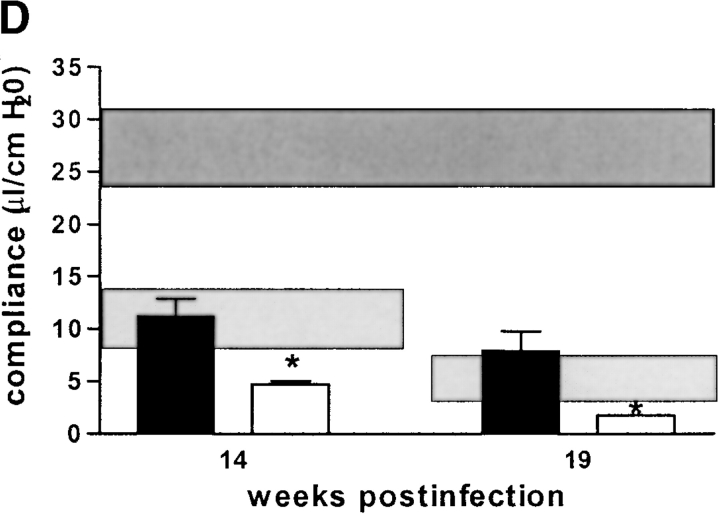
The immunological basis of tuberculin-induced necrosis, known for more than a century as "Koch's phenomenon," remains poorly understood. Aerosol infection in mice with the highly virulent Mycobacterium avium strain TMC724 causes progressive pulmonary pathology strongly resembling caseating necrosis in human patients with tuberculosis. To identify the cellular and molecular mediators causing this pathology, we infected C57BL/6 mice and mice selectively deficient in recombinase activating gene (RAG)-1, alphabeta T cell receptor (TCR), gammadelta TCR, CD4, CD8, beta2-microglobulin, interferon (IFN)-gamma, interleukin (IL)-10, IL-12p35, IL-12p35/p40, or iNOS with M. avium by aerosol and compared bacterial multiplication, histopathology, and respiratory physiology in these mice. The bacterial load in the lung was similarly high in all mouse groups. Pulmonary compliance, as a surrogate marker for granulomatous infiltrations in the lung, deteriorated to a similar extent in all groups of mice, except in alphabeta TCR-knockout (KO) and IL-12-KO mice in which compliance was higher, and in IFN-gamma and inducible nitric oxide synthase-KO mice in which compliance was reduced faster. Progressive caseation of pulmonary granulomas never occurred in alphabeta TCR-KO, IL-12-KO, and IFN-gamma-KO mice and was reduced in CD4-KO mice. In summary, alphabeta TCR(+) cells and IFN-gamma are essential for the development of mycobacteria-induced pulmonary caseous necrosis. In contrast, high mycobacterial load and extensive granulomatous infiltration per se are not sufficient to cause caseation, nor is granuloma necrosis linked to the induction of nitric oxide.


Figures

Figure 2.
Figure 2.
Histopathology of lungs from immunocompetent and T cell subset–deficient mice at 19 wk infection with M. avium. Mice were infected with ∼105 CFU M. avium TMC724 by aerosol, and lungs from infected mice were removed at 19 wk after infection and processed for H&E staining. Low-power micrographs shown are representative of at least three mice per group (A, C, E, G, I, L, and N, original magnifications: ×12; B, D, F, H, K, M, and O, original magnifications: ×32; insert in B, original magnification: ×320). (A and B) C57BL/6 mice. (C and D) RAG-1–KO. (E and F) αβ TCR-KO mice. (G and H) γδ TCR-KO mice. (I and K) CD4-KO mice. (L and M) CD8-KO mice. (N and O) β2M-KO mice.
Figure 2.
Figure 2.
Histopathology of lungs from immunocompetent and T cell subset–deficient mice at 19 wk infection with M. avium. Mice were infected with ∼105 CFU M. avium TMC724 by aerosol, and lungs from infected mice were removed at 19 wk after infection and processed for H&E staining. Low-power micrographs shown are representative of at least three mice per group (A, C, E, G, I, L, and N, original magnifications: ×12; B, D, F, H, K, M, and O, original magnifications: ×32; insert in B, original magnification: ×320). (A and B) C57BL/6 mice. (C and D) RAG-1–KO. (E and F) αβ TCR-KO mice. (G and H) γδ TCR-KO mice. (I and K) CD4-KO mice. (L and M) CD8-KO mice. (N and O) β2M-KO mice.
Figure 1.
Figure 1.
Course of aerosol infection with M. avium in immunocompetent mice C57BL/6 mice were infected with ∼105 CFU M. avium TMC724 by aerosol. (A) Bacterial growth was followed in lungs over time (mean CFU of six mice per group ± SD). (B) Pulmonary compliance was measured in uninfected (white squares) and infected mice (black squares) over time (means of three mice per group ± SD). C shows a compilation of individual compliance measurements from a total of six experiments (white squares, uninfected mice at 14 and 19 wk after infection; black squares, aerosol-infected mice at 14 and 19 wk after infection). The shaded areas represent the 95% confidence interval of all data collected at the indicated time point.
Figure 1.
Figure 1.
Course of aerosol infection with M. avium in immunocompetent mice C57BL/6 mice were infected with ∼105 CFU M. avium TMC724 by aerosol. (A) Bacterial growth was followed in lungs over time (mean CFU of six mice per group ± SD). (B) Pulmonary compliance was measured in uninfected (white squares) and infected mice (black squares) over time (means of three mice per group ± SD). C shows a compilation of individual compliance measurements from a total of six experiments (white squares, uninfected mice at 14 and 19 wk after infection; black squares, aerosol-infected mice at 14 and 19 wk after infection). The shaded areas represent the 95% confidence interval of all data collected at the indicated time point.
Figure 3.
Figure 3.
Bacterial loads in immunocompetent and T cell subset–deficient mice after aerosol infection with M. avium. Mice were infected with ∼105 CFU M. avium TMC724 by aerosol, and bacterial growth was determined in the lungs at indicated time points after infection. Data are the mean CFU ± SD of 4–6 mice per time point. (A) C57BL/6 mice (black bars), RAG-1–KO mice (white bars). (B) C57BL/6 mice (black bars), αβ TCR-KO mice (white bars), γδTCR-KO mice (gray bars). (C) C57BL/6 mice (black bars), CD4-KO mice (white bars), CD8-KO mice (light gray bars), β2M-KO mice (dark gray bars). *P < 0.05 vs. C57BL/6.
Figure 3.
Figure 3.
Bacterial loads in immunocompetent and T cell subset–deficient mice after aerosol infection with M. avium. Mice were infected with ∼105 CFU M. avium TMC724 by aerosol, and bacterial growth was determined in the lungs at indicated time points after infection. Data are the mean CFU ± SD of 4–6 mice per time point. (A) C57BL/6 mice (black bars), RAG-1–KO mice (white bars). (B) C57BL/6 mice (black bars), αβ TCR-KO mice (white bars), γδTCR-KO mice (gray bars). (C) C57BL/6 mice (black bars), CD4-KO mice (white bars), CD8-KO mice (light gray bars), β2M-KO mice (dark gray bars). *P < 0.05 vs. C57BL/6.
Figure 4.
Figure 4.
Pulmonary compliance in immunocompetent and T cell subset–deficient mice after aerosol infection with M. avium. Mice were infected with ∼105 CFU M. avium TMC724 by aerosol, and pulmonary compliance was determined in the isolated and perfused mouse lungs at indicated time points after infection. For purposes of interassay data comparability, the horizontal areas shaded in dark gray represent the 95% confidence interval of measurements from six independent experiments in uninfected mice (Fig. 1 C), and the horizontal areas shaded in light gray represent the 95% confidence interval of measurements taken in infected C57BL/6 mice from six independent experiments (Fig. 1 C). (A) C57BL/6 mice (black bars), RAG-1–KO mice (white bars). (B) C57BL/6 mice (black bars), αβ TCR-KO mice (white bars), γδ TCR-KO mice (gray bars). (C) C57BL/6 mice (black bars), CD4-KO mice (white bars), CD8-KO mice (light gray bars), β2M-KO mice (dark gray bars). Data are the means ± SD of 3–6 mice per group. *P < 0.05 vs. C57BL/6 and γδ TCR-KO mice.
Figure 5.
Figure 5.
Survival of various cytokine- or iNOS-deficient mouse strains after aerosol infection with M. avium. Mice were infected with ∼105 CFU M. avium TMC724 by aerosol, and moribund mice were killed. Data shown are the percentage of surviving mice, the total number of mice per group ranging from 12 to 16.
Figure 6.
Figure 6.
Histopathology of lungs from immunocompetent and cytokine- or iNOS-deficient mice at 19 wk after infection with M. avium. Mice were infected with ∼105 CFU M. avium TMC724 by aerosol, and lungs from infected mice were removed at 19 wk after infection and processed for H&E staining. Micrographs shown are representative of at least three mice per group (A, C, E, G, I, and L, original magnifications: ×12; B, D, F, H, K, and M, original magnifications: ×32; insert in D, original magnification: ×20). (A and B) C57BL/6 mice. (C and D) IFN-γ–KO mice. (E and F) IL-12p35-KO mice. (G and H) IL-12p35/p40-KO mice. (I and K) IL-10–KO mice. (L and M) iNOS-KO mice.
Figure 6.
Figure 6.
Histopathology of lungs from immunocompetent and cytokine- or iNOS-deficient mice at 19 wk after infection with M. avium. Mice were infected with ∼105 CFU M. avium TMC724 by aerosol, and lungs from infected mice were removed at 19 wk after infection and processed for H&E staining. Micrographs shown are representative of at least three mice per group (A, C, E, G, I, and L, original magnifications: ×12; B, D, F, H, K, and M, original magnifications: ×32; insert in D, original magnification: ×20). (A and B) C57BL/6 mice. (C and D) IFN-γ–KO mice. (E and F) IL-12p35-KO mice. (G and H) IL-12p35/p40-KO mice. (I and K) IL-10–KO mice. (L and M) iNOS-KO mice.
Figure 7.
Figure 7.
Bacterial loads in immunocompetent and cytokine- or iNOS-deficient mice after aerosol infection with M. avium. Mice were infected with ∼105 CFU M. avium TMC724 by aerosol, and bacterial growth was determined in the lungs at indicated time points after infection. Data are the mean CFU ± SD of 4–6 mice per time point. (A) C57BL/6 mice (black bars), IFN-γ–KO mice (white bars), ND, not determined due to premature death of mice. (B) C57BL/6 mice (black bars), IL-12p35-KO mice (gray bars), IL-12p35/p40-KO mice (white bars). (C) C57BL/10 mice (black bars), IL-10–KO mice (white bars). (D) C57BL/6 mice (black bars), iNOS-KO mice (white bars). *P < 0.05 vs. C57BL/6.
Figure 7.
Figure 7.
Bacterial loads in immunocompetent and cytokine- or iNOS-deficient mice after aerosol infection with M. avium. Mice were infected with ∼105 CFU M. avium TMC724 by aerosol, and bacterial growth was determined in the lungs at indicated time points after infection. Data are the mean CFU ± SD of 4–6 mice per time point. (A) C57BL/6 mice (black bars), IFN-γ–KO mice (white bars), ND, not determined due to premature death of mice. (B) C57BL/6 mice (black bars), IL-12p35-KO mice (gray bars), IL-12p35/p40-KO mice (white bars). (C) C57BL/10 mice (black bars), IL-10–KO mice (white bars). (D) C57BL/6 mice (black bars), iNOS-KO mice (white bars). *P < 0.05 vs. C57BL/6.
Figure 8.
Figure 8.
Pulmonary compliance in immunocompetent and cytokine- or iNOS-deficient mice after aerosol infection with M. avium. Mice were infected with ∼105 CFU M. avium TMC724 by aerosol, and pulmonary compliance was determined in the isolated and perfused mouse lungs at indicated time points after infection. For purposes of inter-assay data comparability, the horizontal areas shaded in dark gray represent the 95% confidence interval of measurements from six independent experiments in uninfected mice (Fig. 1 C), and the horizontal areas shaded in light gray represent the 95% confidence interval of measurements taken in infected C57BL/6 mice from six independent experiments (Fig. 1 C). (A) C57BL/6 mice (black bars), IFN-γ–KO mice (white bars), ND, not determined due to premature death of mice. (B) C57BL/6 mice (black bars), IL-12p35-KO mice (gray bars), IL-12p35/p40-KO mice (white bars). (C) C57BL/10 mice (black bars), IL-10–KO mice (white bars). (D) C57BL/6 mice (black bars), iNOS-KO mice (white bars). Data are the means ± SD of three mice per group. *P < 0.05 vs. C57BL/6 mice.
Figure 8.
Figure 8.
Pulmonary compliance in immunocompetent and cytokine- or iNOS-deficient mice after aerosol infection with M. avium. Mice were infected with ∼105 CFU M. avium TMC724 by aerosol, and pulmonary compliance was determined in the isolated and perfused mouse lungs at indicated time points after infection. For purposes of inter-assay data comparability, the horizontal areas shaded in dark gray represent the 95% confidence interval of measurements from six independent experiments in uninfected mice (Fig. 1 C), and the horizontal areas shaded in light gray represent the 95% confidence interval of measurements taken in infected C57BL/6 mice from six independent experiments (Fig. 1 C). (A) C57BL/6 mice (black bars), IFN-γ–KO mice (white bars), ND, not determined due to premature death of mice. (B) C57BL/6 mice (black bars), IL-12p35-KO mice (gray bars), IL-12p35/p40-KO mice (white bars). (C) C57BL/10 mice (black bars), IL-10–KO mice (white bars). (D) C57BL/6 mice (black bars), iNOS-KO mice (white bars). Data are the means ± SD of three mice per group. *P < 0.05 vs. C57BL/6 mice.

Similar articles

Cited by

References

    1. Dannenberg, A.M., Jr. 1991. Delayed-type hypersensitivity and cell-mediated immunity in the pathogenesis of tuberculosis. Immunol. Today. 12:228–233. - PubMed
    1. Cotran, R.S., V. Kumar, and S.L. Robbins. 1994. Inflammation and repair. Robbins Pathologic Basis of Disease. R.S. Cotran, S. Robbins, and V. Kumar, editors. W.B. Saunders Company, Philadelphia, PA. pp. 51–92.
    1. Ehlers, S. 1999. Immunity to tuberculosis: a delicate balance between protection and pathology. FEMS Immunol. Med. Microbiol. 23:149–158. - PubMed
    1. Dannenberg, A.M., Jr. 1999. Pathophysiology: basic aspects. Tuberculosis and Nontuberculous Mycobacterial Infections. D. Schlossberg, editor. W.B. Saunders Company, Philadelphia, PA. pp. 17–47.
    1. Jagirdar, J., and D. Zagzag. 1996. Pathology and insights into pathogenesis of tuberculosis. Tuberculosis. W.N. Rom, and S. Garay, editors. Little, Brown, and Co., Boston, MA. pp. 467–482.

Publication types

MeSH terms