. 2001 Dec 17;194(12):1861-74.
doi: 10.1084/jem.194.12.1861.

Constitutive nuclear factor kappaB activity is required for survival of activated B cell-like diffuse large B cell lymphoma cells

Affiliations

Constitutive nuclear factor kappaB activity is required for survival of activated B cell-like diffuse large B cell lymphoma cells

R E Davis et al. J Exp Med. .

Abstract

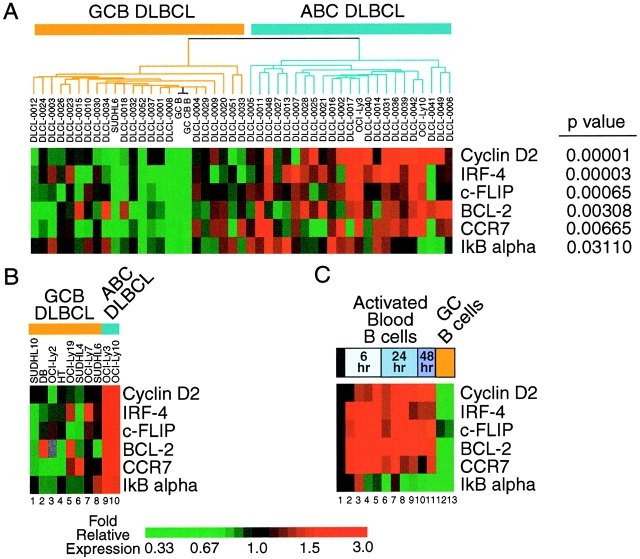
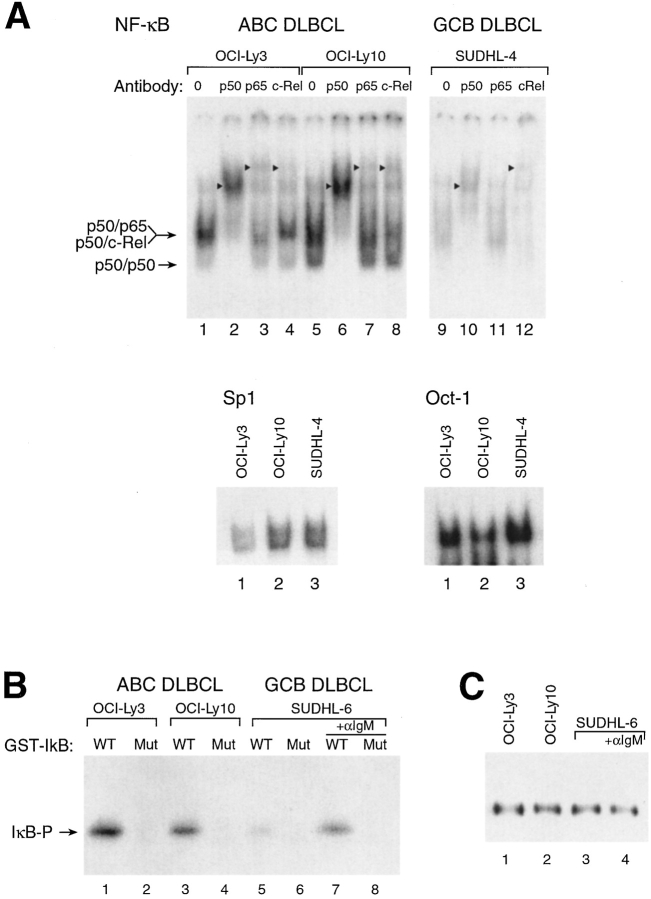
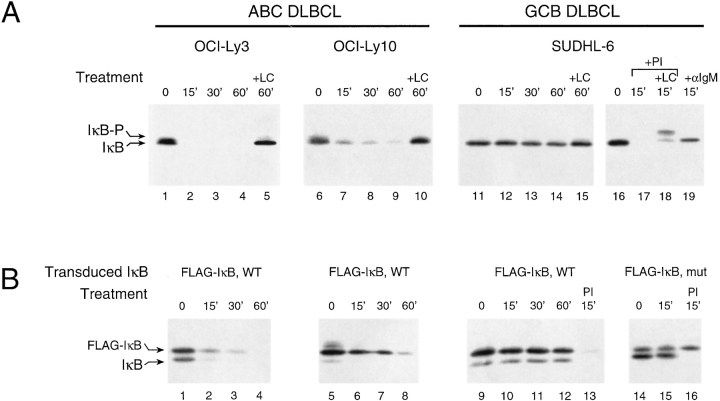
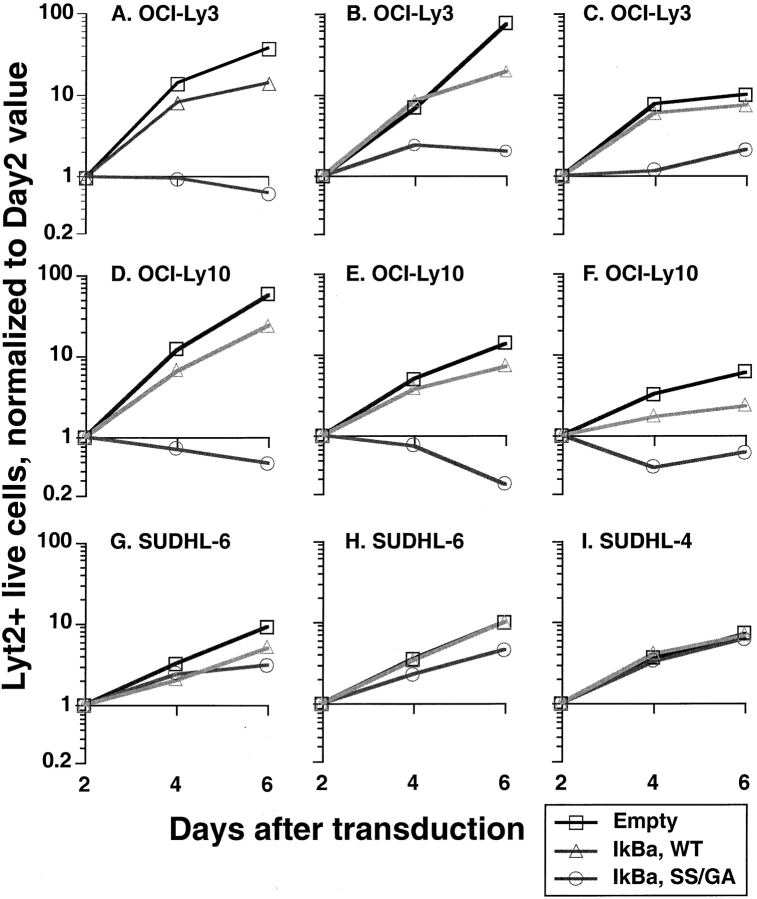
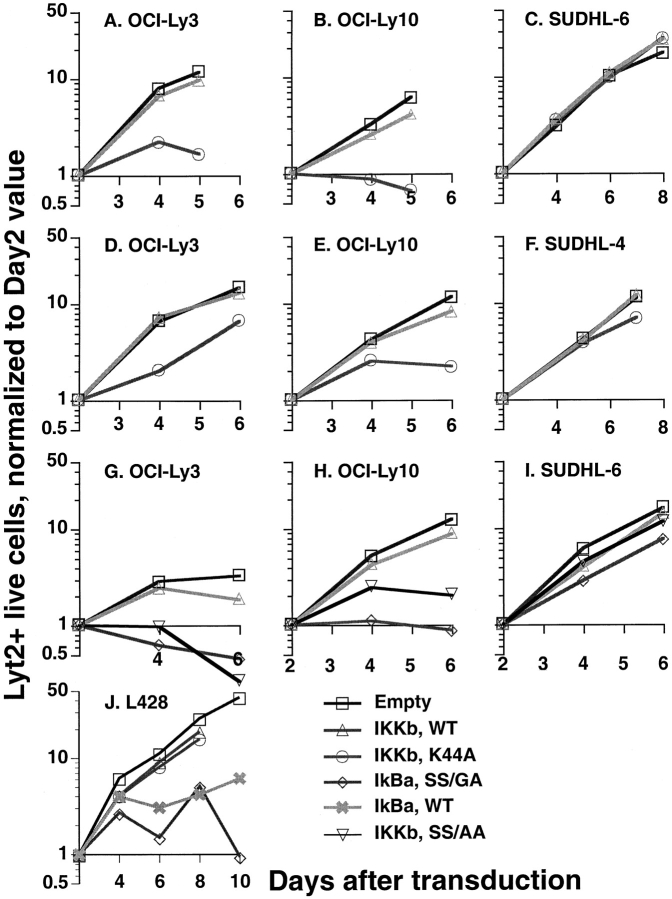
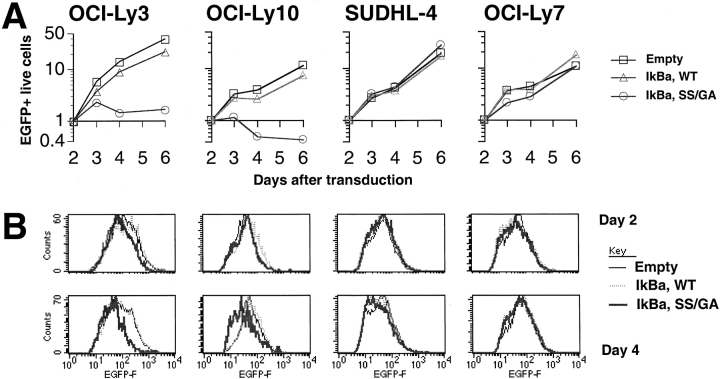
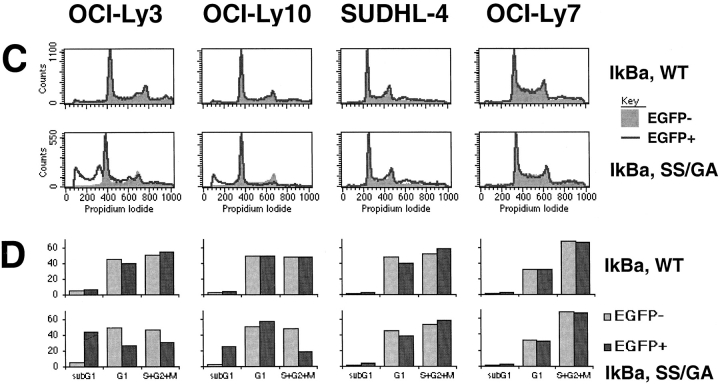
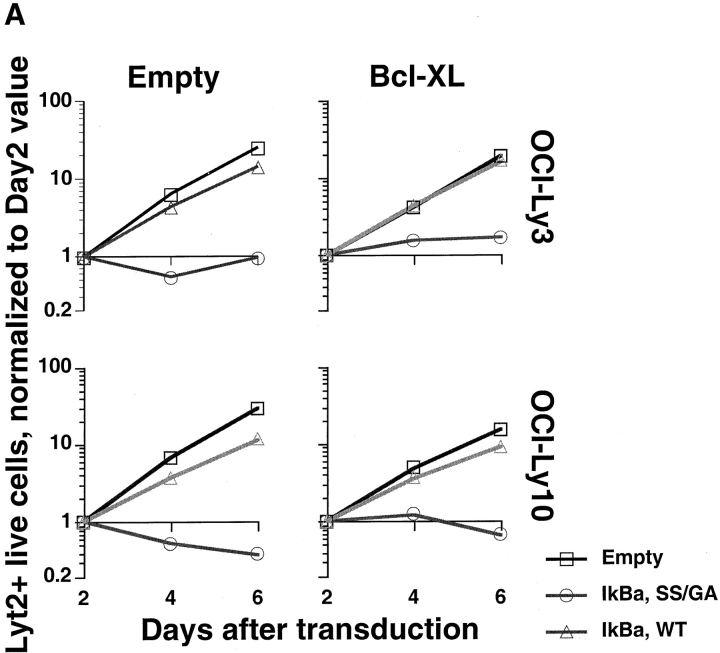
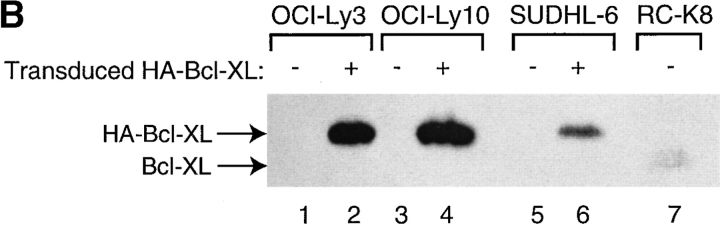
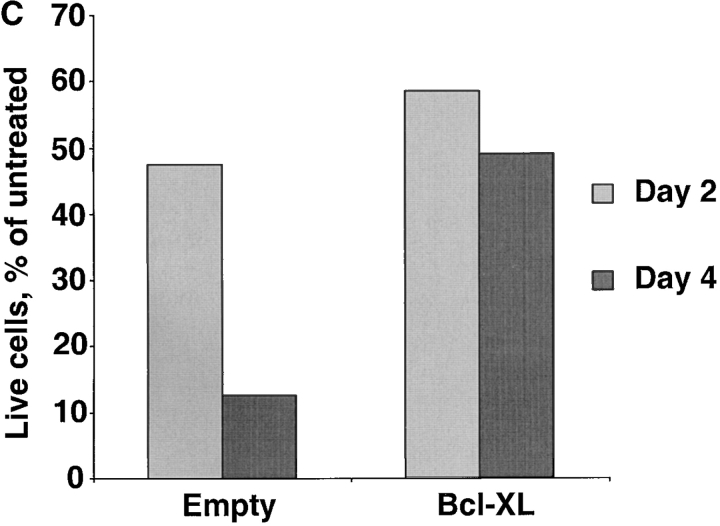
Gene expression profiling has revealed that diffuse large B cell lymphoma (DLBCL) consists of at least two distinct diseases. Patients with one DLBCL subtype, termed activated B cell-like (ABC) DLBCL, have a distinctly inferior prognosis. An untapped potential of gene expression profiling is its ability to identify pathogenic signaling pathways in cancer that are amenable to therapeutic attack. The gene expression profiles of ABC DLBCLs were notable for the high expression of target genes of the nuclear factor (NF)-kappaB transcription factors, raising the possibility that constitutive activity of the NF-kappaB pathway may contribute to the poor prognosis of these patients. Two cell line models of ABC DLBCL had high nuclear NF-kappaB DNA binding activity, constitutive IkappaB kinase (IKK) activity, and rapid IkappaB(alpha) degradation that was not seen in cell lines representing the other DLBCL subtype, germinal center B-like (GCB) DLBCL. Retroviral transduction of a super-repressor form of IkappaBalpha or dominant negative forms of IKKbeta was toxic to ABC DLBCL cells but not GCB DLBCL cells. DNA content analysis showed that NF-kappaB inhibition caused both cell death and G1-phase growth arrest. These findings establish the NF-kappaB pathway as a new molecular target for drug development in the most clinically intractable subtype of DLBCL and demonstrate that the two DLBCL subtypes defined by gene expression profiling utilize distinct pathogenetic mechanisms.


Figures

Figure 1.
Figure 1.
DNA microarray analysis of NF-κB target gene expression in DLBCL. Results shown are the average of two different cDNA clones used to measure expression of each NF-κB target gene. Relative expression is displayed according to the color scale shown. (A) Expression in DLBCL lymph node biopsy samples. DLBCL cases are ordered and subdivided into GCB and ABC subtypes as defined in Fig. 1 of reference . (B) Expression in DLBCL cell lines. (C) Expression in normal B cell differentiation and activation. Data and samples correspond to those used in Fig. 4 of reference . Lanes 1–11 are adult blood CD19+ B cells: lane 1, resting; lanes 2 and 6, anti-IgM; lanes 3 and 7, anti-IgM plus CD40L; lanes 4 and 8, anti-IgM plus IL-4; lanes 5 and 9, anti-IgM plus CD40L plus IL-4; lane 10, anti-IgM plus CD40L (low concentration); lane 11, anti-IgM plus CD40L (high concentration). Lanes 12 and 13 are tonsil germinal center B cells: lane 12, total B cells; lane 13, centroblasts. In a “time zero transformation,” the data have been normalized to values obtained in resting blood B cells, and therefore the first column (lane 1) is entirely black.
Figure 2.
Figure 2.
NF-κB and IKK kinase are constitutively active in ABC DLBCL but not GCB DLBCL cell lines. (A) EMSAs of nuclear extracts from DLBCL cell lines for NF-κB DNA-binding activity. Supershifting antibodies are indicated, as is the mobility of NF-κB heterodimers. Arrowheads indicate the position of supershifted bands. The identity of the p50/p50 homodimer species was established by comparison with extracts of cells transfected with (and overexpressing) p50 (data not shown). EMSAs using Oct-1 and Sp1 probes showed no increased binding activity in ABC DLBCL lines relative to GCB DLBCL lines. Equivalent amounts of protein (10 μg) were used for all reactions. Comparable results were obtained with the GCB DLBCL line SUDHL-6 (data not shown). (B) IKK kinase assay of anti-IKKγ immune complexes from DLBCL cell lines. GST-IκBα (amino acids 1–72) was substrate as follows: WT, wild-type IκBα amino acids 1–72; Mut, IκBα amino acids 1–72 with phosphoacceptor serine residues 32 and 36 substituted by glycine and alanine, respectively. Where indicated, SUDHL-6 cells were activated with anti-IgM (Jackson ImmunoResearch Laboratories) for 10 min before extraction. (C) Western blot analysis of immunoprecipitated IKKγ complexes used in B. Western blots were developed with an antibody to IKKα.
Figure 3.
Figure 3.
(A) Rapid, constitutive, and proteasome-dependent degradation of IκBα in ABC DLBCL cell lines. Western blot analysis of IκBα in extracts of CHX-treated cells (5 × 10⁵ cells per lane, 20 μg/ml CHX). SUDHL-6 showed stable IκBα unless cells were activated for the times indicated by PMA (Sigma-Aldrich; 40 ng/ml plus ionomycin) (Calbiochem; 2 μM) (PI) or anti-IgM (50 μg/ml). The more slowly migrating form of IκBα (IκB-P) seen in cells treated with clastolactacystin β−lactone (LC; Calbiochem, 80 μM), the active metabolite of lactacystin, most likely represents phosphorylated IκB. (B) Ectopically expressed wild-type IκBα was degraded similarly to endogenous IκBα in ABC and GCB DLBCL cell lines. Western blot analysis of IκBα in extracts of CHX-treated cells stably transduced with retroviruses expressing FLAG epitope-tagged wild-type IκBα or super-repressor IκBα (S32G/S36A) and treated with CHX with and without PI for the times indicated. In SUDHL-6, the super-repressor form of FLAG-tagged IκBα did not affect the degradation of endogenous IκBα induced by PI but was itself resistant to degradation.
Figure 4.
Figure 4.
Responses of DLBCL cell lines to transduction with super-repressor IκBα. The results of individual experiments are shown; those shown for the same cell line were obtained from separate transductions performed at different times. For each experiment, equal numbers of cells were transduced with vLyt-2 retrovirus containing wild-type IκBα, SS mutant (S32G/S36A) IκBα, or insert-empty vector. For each vector, equal volumes of the same viral supernatants were applied to the different lines. On the days shown after transduction, live transduced cells were quantified by flow cytometry as described in Materials and Methods, using FITC-conjugated anti–mouse CD8a (Lyt-2), ethidium, and beads. Results from each cell line, vector, and transduction were normalized to the corresponding day 2 value.
Figure 5.
Figure 5.
Responses of DLBCL cell lines to transduction with mutant IKKβ. The results of individual experiments are shown; those shown for the same cell line were obtained from separate transductions performed at different times. For each cell line, equal numbers of cells were transduced with wild-type IKKβ, kinase-inactive mutant (K44A) IKKβ, activation-loop mutant (S177A/S181/A) IKKβ, or insert-empty vLyt-2 retrovirus. Hodgkin's lymphoma cell line L428 was also transduced with vLyt-2 retrovirus containing forms of IκBα or IKKβ. For each vector, equal amounts of the same viral supernatants were applied to the different lines. Live transduced cells were enumerated by flow cytometry on days shown, as in Fig. 4. Results from each cell line, vector, and transduction were normalized to the corresponding day 2 value.
Figure 6.
Figure 6.
Toxicity of super-repressor IκBα in ABC DLBCL lines. (A) Response of ABC DLBCL lines OCI-Ly3 and OCI-Ly10, and GCB DLBCL lines SUDHL-4 and OCI-Ly7, to transduction with bicistronic retroviruses expressing EGFP as well as wild-type IκBα, super-repressor SS/GA mutant (S32G/S36A) IκBα, or no insert. Absolute numbers of live EGFP+ cells were enumerated by flow cytometry on days shown, and normalized to the corresponding day 2 value. (B) Histograms of EGFP fluorescence in live transduced cells. For each cell line and day after transduction, histograms for live EGFP+ cells from the three retroviruses were normalized based on the maximum count value for each. (C) Histograms of DNA content, based on propidium iodide staining of all cells in cultures 4 d after transduction. For each cell line and retrovirus, histograms for EGFP and EGFP+ cells were normalized based on the maximum count value for each. The histograms for EGFP cells are shown shaded and filled, while EGFP+ cells are shown as a line. Results for empty retrovirus (data not shown) were similar to those for wild-type IκBα. (D) Relative proportions of sub-G1, G1, and G2+M phase cells 4 d after transduction. Values are shown for the comparable EGFP and EGFP+ cells.
Figure 6.
Figure 6.
Toxicity of super-repressor IκBα in ABC DLBCL lines. (A) Response of ABC DLBCL lines OCI-Ly3 and OCI-Ly10, and GCB DLBCL lines SUDHL-4 and OCI-Ly7, to transduction with bicistronic retroviruses expressing EGFP as well as wild-type IκBα, super-repressor SS/GA mutant (S32G/S36A) IκBα, or no insert. Absolute numbers of live EGFP+ cells were enumerated by flow cytometry on days shown, and normalized to the corresponding day 2 value. (B) Histograms of EGFP fluorescence in live transduced cells. For each cell line and day after transduction, histograms for live EGFP+ cells from the three retroviruses were normalized based on the maximum count value for each. (C) Histograms of DNA content, based on propidium iodide staining of all cells in cultures 4 d after transduction. For each cell line and retrovirus, histograms for EGFP and EGFP+ cells were normalized based on the maximum count value for each. The histograms for EGFP cells are shown shaded and filled, while EGFP+ cells are shown as a line. Results for empty retrovirus (data not shown) were similar to those for wild-type IκBα. (D) Relative proportions of sub-G1, G1, and G2+M phase cells 4 d after transduction. Values are shown for the comparable EGFP and EGFP+ cells.
Figure 7.
Figure 7.
BCL-2 family members fail to block the toxicity of NF-κB inhibition. (A) The indicated ABC DLBCL cell lines were transduced with vXY-Puro retrovirus expressing BCL–XL or control retrovirus and puromycin-selected, then transduced with vLyt-2 retrovirus expressing forms of IκBα or control retrovirus. Live vLyt2-transduced cells were quantitated as indicated in the legend to Fig. 4. Values represent the average of two experiments with BCL–XL-transduced lines and three with control lines. (B) Western blot analysis for expression of endogenous and transduced (HA-tagged) BCL–XL, probed with antibody to BCL–XL COOH terminus. Lines transduced with vXY-Puro retrovirus expressing BCL–XL were puromycin-selected. Other lines shown were untransduced, including RC-K8, a DLBCL line with high expression of endogenous BCL–XL mRNA and protein. (C) Effect of BCL–XL on survival of SUDHL-6 after BCR cross-linking. In cells transduced with BCL–XL or control retrovirus, the number of live cells in cultures treated with anti-IgM was compared with that in matched untreated cultures.
Figure 7.
Figure 7.
BCL-2 family members fail to block the toxicity of NF-κB inhibition. (A) The indicated ABC DLBCL cell lines were transduced with vXY-Puro retrovirus expressing BCL–XL or control retrovirus and puromycin-selected, then transduced with vLyt-2 retrovirus expressing forms of IκBα or control retrovirus. Live vLyt2-transduced cells were quantitated as indicated in the legend to Fig. 4. Values represent the average of two experiments with BCL–XL-transduced lines and three with control lines. (B) Western blot analysis for expression of endogenous and transduced (HA-tagged) BCL–XL, probed with antibody to BCL–XL COOH terminus. Lines transduced with vXY-Puro retrovirus expressing BCL–XL were puromycin-selected. Other lines shown were untransduced, including RC-K8, a DLBCL line with high expression of endogenous BCL–XL mRNA and protein. (C) Effect of BCL–XL on survival of SUDHL-6 after BCR cross-linking. In cells transduced with BCL–XL or control retrovirus, the number of live cells in cultures treated with anti-IgM was compared with that in matched untreated cultures.

Similar articles

Cited by

References

    1. Baldwin, A.S., Jr. 1996. The NF-κB and I κB proteins: new discoveries and insights. Annu. Rev. Immunol. 14:649–683. - PubMed
    1. Ghosh, S., M.J. May, and E.B. Kopp. 1998. NF-κB and Rel proteins: evolutionarily conserved mediators of immune responses. Annu. Rev. Immunol. 16:225–260. - PubMed
    1. Karin, M., and Y. Ben-Neriah. 2000. Phosphorylation meets ubiquitination: the control of NF-κB activity. Annu. Rev. Immunol. 18:621–663. - PubMed
    1. Siebenlist, U., G. Franzoso, and K. Brown. 1994. Structure, regulation and function of NF-κB. Annu. Rev. Cell Biol. 10:405–455. - PubMed
    1. Gugasyan, R., R. Grumont, M. Grossmann, Y. Nakamura, T. Pohl, D. Nesic, and S. Gerondakis. 2000. Rel/NF-κB transcription factors: key mediators of B-cell activation. Immunol. Rev. 176:134–140. - PubMed

MeSH terms