. 2002 Jan 1;168(1):338-47.
doi: 10.4049/jimmunol.168.1.338.

Intensity of the vaccine-elicited immune response determines tumor clearance

Affiliations

Intensity of the vaccine-elicited immune response determines tumor clearance

Ainhoa Perez-Diez et al. J Immunol. .

Abstract

Tumor Ag-specific vaccines used for cancer immunotherapy can generate specific CD8 responses detectable in PBMCs and in tumor-infiltrating lymphocytes. However, human studies have shown that detection of a systemic vaccine-induced response does not necessarily correlate with the occasional instances of tumor rejection. Because this discrepancy might partially be attributable to the genetic heterogeneity of human cancers, as well as to the immunosuppressive effects of previous treatments, we turned to a mouse model in which these variables could be controlled to determine whether a relationship exists between the strength of vaccine-induced immune responses and tumor rejection. We challenged mice with the beta-galactosidase (beta-gal)-expressing tumor cells, C25.F6, vaccinated them with beta-gal-carrying viral vectors, and used quantitative RT-PCR to measure the vaccine-induced immune response of splenocytes directly ex vivo. We found that the strength of the response increased with increasing doses of beta-gal-carrying vector and/or upon boosting with a heterologous beta-gal-carrying virus. Most importantly, we found that the strength of the detected immune response against this foreign Ag strongly correlated with reduction in the number of lung metastases. The results from this mouse model have major implications for the implementation of tumor vaccines in humans.


Figures

FIGURE 1
FIGURE 1
Primers and probes designed for quantitative RT-PCR of murine IL-2, IL-4, IL-10, TNF-α, IFN-γ, and CD8 genes. a, F, forward primers, and R, reverse primers were used at 200 nM; P, probe was used at 100 nM and was labeled at the 5′ end with the reporter dye molecule 6-carboxyfluo-rescein and at the 3′ end with the quencher dye molecule 6-carboxytetramethylrhodamine. The figure shows the position of the primers and probes with respect to the exon (e)-intron junctions and the base pair number of each amplicon. b, Amplification plot obtained after quantitative PCR of 10-fold dilutions of TNF-α amplicon used to generate its standard curve. Dilutions (from 108 to 103 copies of templates per sample) were amplified in duplicate and are represented as gradually diminishing open circles, the largest corresponding to 108 and the line without circles to 103 copies per sample. c, Standard curves from quantitative PCR of serial dilutions of standard template copies of each gene. Overlapping points on standard curves represent templates assayed in duplicate. The equations represent the regression lines for each gene.
FIGURE 2
FIGURE 2
Ex vivo detection of β-gal reactivity after one or two vaccinations with a gradually increased dose of β-gal-carrying vectors. Thirty-one mice were divided into seven groups receiving i.v. different amounts of βFPV (three mice per group receiving 102 or 103 PFUs and five mice per group receiving from 104 to 108 PFUs). Seven days later, one mouse per group was sacrificed to ex vivo quantify β-gal reactivity in the spleen. Fourteen days after the first vaccination, two mice from each experimental group were boosted i.v. with βVV by administering the same PFUs that they had received when vaccinated previously with βFPV (from 102 to 108). The rest of the mice (from groups vaccinated previously from 104 to 108 PFUs of βFPV) were injected with corresponding PFUs of cVV. Seven days after the last vaccination, mice were sacrificed to ex vivo quantify β-gal reactivity in the spleen. β-gal reactivity was quantified by stimulating 5 × 10⁵ splenocytes with β-gal epitope (1 µM) or with the β-gal-positive clone C25.F6 (105 cells). As controls, splenocytes were incubated with the same concentration or number of Flu epitope or the β-gal negative cell line CT26, respectively. After 2 h of sensitization, RNA was extracted from every well and qRT-PCR was conducted to determine whether IFN-γ mRNA production normalized to CD8 mRNA for each well. Stimulation was conducted for 2 h either with peptide or tumor cells, based on previous kinetic studies suggesting that the peak of IFN-γ transcript expression occurs within 2–3 h (data not shown). Ratio IFN-γ was calculated as described in Table I. a, The ratio of IFN-γ from one mouse per group after βFPV vaccination. b, The ratio of IFN-γ from two mice per group after a second vaccination with cVV. c, The ratio of IFN-γ from two mice per group after a second vaccination with βVV. Circles and triangles represent the ratio of IFN-γ after peptide and tumor sensitization, respectively.
FIGURE 3
FIGURE 3
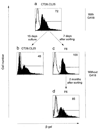
Stable β-gal expression by the F6 clone compared with the CT26.CL25 cell line. The CT26.CL25 cell line, derived from the CT26 cell line after transfection with the β-gal gene, and the F6 clone, derived from the CT26.CL25 cell line after two consecutive rounds of sorting, were analyzed by FACS for β-gal expression using FDG staining after being in culture in the presence (CT26.CL25) or absence (both) of selection medium. a, β-gal expression of CT26.CL25 cell line cultured in presence of G418. b, β-gal expression of the same line after 15 days of in vitro culture without G418. c, β-gal expression of clone F6 7 days after the second round of FACS sorting of high β-gal-positive cells from a. d, β-gal expression of the same clone after 2 mo of in vitro culture without selection medium. The empty continuous line represents the FDG-stained CT26 cell line. The discontinuous line represents unstained F6 clone. Numbers in the upper right corner of the histograms represent the percentage of β-gal-positive cells.
FIGURE 4
FIGURE 4
Mice with higher β-gal-specific immune responses reject β-gal-expressing tumors. Two experiments were performed in a similar way with slight variations in the number of mice per group and treatment groups. Forty-four and 34 mice (experiment one and two, respectively) were challenged i.v. with 105 F6 tumor cells. Three days later, the mice in experiment one were divided into eight treatment groups: untreated (n = 6); vaccinated with 107 PFUs of control virus, cFPV (n = 6); vaccinated i.v. with increasing doses of βFPV (n = 6 for doses of 102 and 104 PFUs and n = 5 for doses of 103, 105, 106, and 107 PFUs). The mice in experiment two were divided into seven treatment groups: untreated (n = 5); vaccinated i.v. with increasing doses of βFPV (n = 5 for doses of 103, 105, 106, 107, and 108 and n = 4 for 104). Twelve days after the primary vaccination, the vaccinated mice were boosted with the same dose of βVV (for βFPV primed mice), or of cVV for the control group. Seven days later, the mice were sacrificed, their lungs were coded, and metastases were enumerated by an observer ignorant of the code. Spleens from between one and three mice per treatment group were removed and analyzed for ex vivo specific IFN-γ mRNA production as described in the Materials and Methods section. a, The number of lung metastases per mouse in each treatment group. The horizontal line represents the average of lung metastases. * or **, Treatment group with significantly (p < 0.05) or very significantly (p < 0.01) fewer metastases than the untreated group. b, The ratio of IFN-γ between β-gal and Flu peptide-sensitized cells. c, The ratio of IFN-γ between F6 and CT26 tumor-sensitized cells. The ratio of IFN-γ was calculated as described in Table I. In each experiment, the same kind of open symbol (triangle, square, or circle) per treatment group represents the same mouse, where both lung metastases and ex vivo anti-β-gal activity (against CD8 epitope and F6 clone) in the spleen were quantified.
FIGURE 5
FIGURE 5
Mice with higher specific immune responses generated by i.p. vaccination reject β-gal-expressing tumors. Thirty-two mice were challenged i.v. with 2 × 10⁵ F6 tumor cells. Three days later, mice were divided into six treatment groups: untreated (n = 6), and vaccinated i.p. with increasing doses of β-gal viruses (n = 5 for doses of 103, 104, 105, and 106 cells; n = 4 for 107 PFUs). One small group (n = 3) received two i.v. vaccinations with 107 PFUs of β-gal viruses as a positive control. The rest of the experiment was performed in the same manner as described in Fig. 4. a, The number of lung metastases per mouse in each treatment group. The horizontal line represents the average of lung metastases. *, The treatment group with significantly less numbers of metastases (p < 0.05) than the untreated group. b, The ratio of IFN-γ between β-gal and Flu peptide-sensitized splenocytes from two mice from each group, except from untreated and i.v.-treated groups, where one mouse was tested. The ratio of IFN-γ was calculated as described in Table I.
FIGURE 6
FIGURE 6
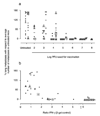
Ex vivo tumor Ag-specific CD8 activity better correlates than the vaccine dose with tumor rejection. a, The number of metastases with respect to the vaccine dose in mice vaccinated with β-gal-carrying vectors i.v. (n = 75, filled circle) or i.p. (n = 50, open circle) in data pooled from three individual experiments (Fig. 4 and Fig. 5). Horizontal lines represent the average of lung metastases in vaccinated mice. b, Number of metastases with respect to ex vivo-specific IFN-γ mRNA production in 49 mice from 4 individual experiments where the route and dose of vaccination varied. The ratio of IFN-γ refers to ex vivo β-gal peptide sensitization and was calculated as described in Table I. The percentage of lung metastases with respect to the average metastases in untreated mice is the number obtained after dividing the number of metastases found in each mouse by the average number of metastases in untreated mice from the same experiment and multiplying by 100. The same delineating symbol in a and b represents the same mouse.

Similar articles

Cited by

References

    1. Boon T, Coulie PG, Van den Eynde B. Tumor antigens recognized by T cells. Immunol. Today. 1997;18:267. - PubMed
    1. Rosenberg SA. Cancer vaccines based on the identification of genes encoding cancer regression antigens. Immunol. Today. 1997;18:175. - PubMed
    1. Old LJ, Chen YT. New paths in human cancer serology. J. Exp. Med. 1998;187:1163. - PMC - PubMed
    1. Cormier JN, Salgaller ML, Prevette T, Barracchini KC, Rivoltini L, Restifo NP, Rosenberg SA, Marincola FM. Enhancement of cellular immunity in melanoma patients immunized with a peptide from MART-1/Melan A. Cancer J. Sci. Am. 1997;3:37. - PMC - PubMed
    1. Gajewski TF. Monitoring specific T-cell responses to melanoma vaccines: ELISPOT, tetramers and beyond. Clin. Diagn. Lab. Immunol. 2000;7:141. - PMC - PubMed

Publication types

MeSH terms