. 2002 Jan;76(2):582-90.
doi: 10.1128/jvi.76.2.582-590.2002.

The magnitude and specificity of influenza A virus-specific cytotoxic T-lymphocyte responses in humans is related to HLA-A and -B phenotype

Affiliations

The magnitude and specificity of influenza A virus-specific cytotoxic T-lymphocyte responses in humans is related to HLA-A and -B phenotype

A C M Boon et al. J Virol. 2002 Jan.

Abstract

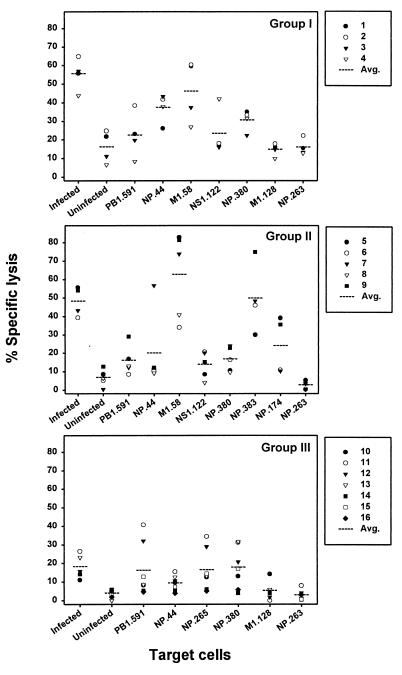
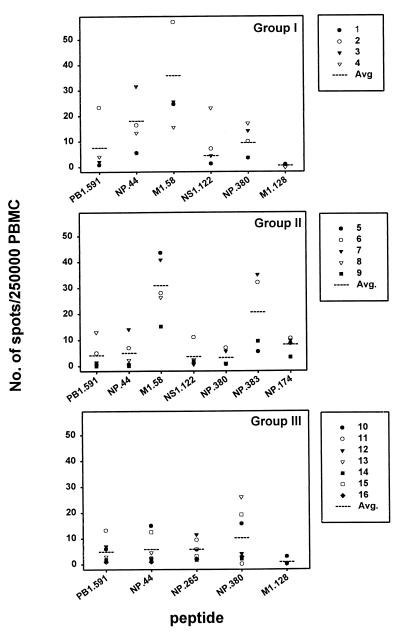
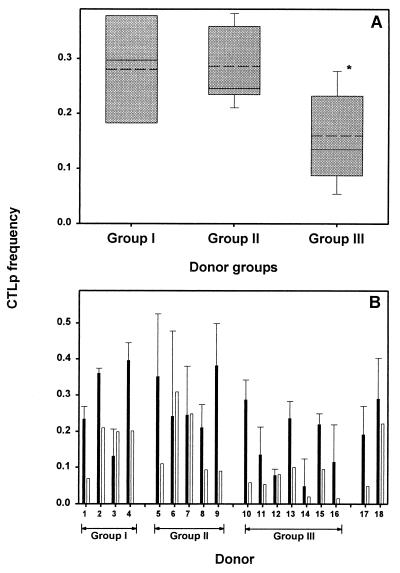
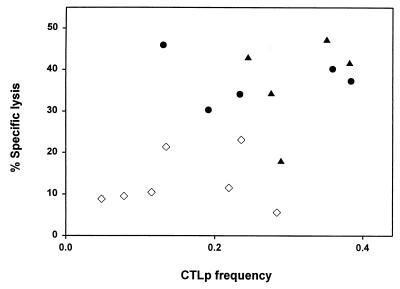
The repertoire of human cytotoxic T-lymphocytes (CTL) in response to influenza A viruses has been shown to be directed towards multiple epitopes, with a dominant response to the HLA-A2-restricted M1(58-66) epitope. These studies, however, were performed with peripheral blood mononuclear cells (PBMC) of individuals selected randomly with respect to HLA phenotype or selected for the expression of one HLA allele without considering an influence of other HLA molecules. In addition, little information is available on the influence of HLA makeup on the overall CTL response against influenza viruses. Here, the influenza A virus-specific CTL response was investigated in groups of HLA-A and -B identical individuals. Between groups the individuals shared two or three of the four HLA-A and -B alleles. After in vitro stimulation of PBMC with influenza virus, the highest CTL activity was found in HLA-A2(+) donors. A similar pattern was observed for the precursor frequency of virus-specific CTL (CTLp) ex vivo, with a higher CTLp frequency in HLA-A2-positive donors than in HLA-A2-negative donors, which were unable to recognize the immunodominant M1(58-66) epitope. In addition, CTL activity and frequency of CTLp for the individual influenza virus epitopes were determined. The frequency of CTLp specific for the HLA-B8-restricted epitope NP(380-388) was threefold lower in HLA-B27-positive donors than in HLA-B27-negative donors. In addition, the frequency of CTLp specific for the HLA-A1-restricted epitope NP(44-52) was threefold higher in HLA-A1-, -A2-, -B8-, and -B35-positive donors than in other donors, which was confirmed by measuring the CTL activity in vitro. These findings indicate that the epitope specificity of the CTL response is related to the phenotype of the other HLA molecules. Furthermore, the magnitude of the influenza virus-specific CTL response seems dependent on the HLA-A and -B phenotypes.


Figures

FIG. 1.
FIG. 1.
Ability of influenza virus-infected PBMC to activate an influenza virus-specific CTL clone. Influenza virus-infected (Resvir-9, MOI = 3) PBMC or uninfected PBMC from two HLA-A1-positive, HLA-A2-negative donors (A and B) were incubated in the presence of serially diluted HLA-A2+ A1/NP clone. The percentage of IFN-γ-positive cells within the A1/NP population was determined by flow cytometry by using HLA-A2-specific antibodies (▾). The calculated percentage of IFN-γ-producing cells of A1/NP clone, determined after multiplying the maximal percentage of IFN-γ-positive A1/NP cells after stimulation with NP44–52 (5 μM)-loaded HLA-A1-positive, HLA-A2-negative BLCL (58.1%) with the percentage of cells of the A1/NP clone present within the total PBMC population, was plotted (dotted lines). When the experimental value (percentage of IFN-γ-positive cells) is similar to the calculated value, the virus-infected PBMC are able to stimulate the cells of the A1/NP clone. Uninfected PBMC did not induce IFN-γ production at any percentage of cells of the A1/NP clone (•). The results represent the averages of duplicate wells.
FIG. 2.
FIG. 2.
CD8+ T cells mediate CTL activity of PBMC after in vitro stimulation with influenza virus. Uninfected PBMC (donor 7) were stimulated in vitro with influenza virus-infected PBMC (Resvir-9, MOI = 3) at a ratio of 1:1, and virus-specific T cells were expanded for 9 days. Subsequently the effector cells were divided into three portions: CD4 depleted (panel C and open bars in panel D), CD8 depleted (panel B and grey bars in panel D), or unseparated (panel A and black bars in panel D). Confirmation of depletion was done by flow cytometry (>99% pure). The effector cells were added to Na2[51Cr]O4-labeled target cells (BLCL) at an E:T ratio of 10:1. BLCL were infected with influenza A virus (Resvir-9, MOI = 1), left uninfected, or pulsed with 5 μM HLA-matched viral peptide (as indicated). Results are given as the averages of triplicate wells ± SD.
FIG. 3.
FIG. 3.
Influenza virus- and epitope-specific CTL activity in PBMC from donors with identical HLA-A and -B phenotypes. PBMC were stimulated with influenza virus, and the resulting effector cells were tested for CTL activity against radioactively labeled HLA-A- and HLA-B-matched target cells (BLCL), either infected with influenza virus (Resvir-9, MOI = 1), left uninfected, or loaded with 5 μM peptide (as indicated) at an E:T ratio of 20:1. The three groups correspond to HLA-A1-, HLA-A2-, HLA-B8-, HLA-B35-positive donors (group I); HLA-A1-, HLA-A2-, HLA-B8-, HLA-B27-positive donors (group II); and HLA-A1-, HLA-A3-, HLA-B8-, HLA-B35-positive donors (group III). The percentage of specific lysis was calculated from at least three wells, and the average CTL activity for a given target cell within a group is plotted (dotted line). The CTL activity against virus-infected BLCL and HLA-B27 peptide-pulsed BLCL were not included for donor 8 (HLA-B*2702+). Furthermore, donors 15 and 16 (HLA-B*3503+) were excluded from the calculation of CTL activity specific for virus-infected BLCL and HLA-B*3501-restricted epitope M1128–135-pulsed BLCL.
FIG. 4.
FIG. 4.
Frequency of CTLp specific for individual influenza virus epitopes. PBMC from HLA-A and -B identical donors were tested for the frequency of influenza A virus epitope-specific CTLp ex vivo by using an ELISPOT assay. The graphs represent the different groups of donors: group I (HLA-A1, -A2, -B8, -B35), group II (HLA-A1, -A2, -B8, -B27), and group III (HLA-A1, -A3, -B8, -B35). The number of spots per 2.5 × 10⁵ PBMC specific for each epitope is given for each donor individually, and the average number of spots is given for the entire group (dotted line). The data are given as the average numbers of specific spots derived from two independent experiments in quadruplicate wells, counted by two individuals. Data from donor 8 (HLA-B*2702+) and donors 15 and 16 (HLA-B*3503+) were excluded for NP383–391 and M1128–135, respectively.
FIG. 5.
FIG. 5.
Lower influenza virus-specific CTLp frequencies in HLA-A2-negative donors. (A) The influenza A virus-specific CTLp frequency (presented as the percentage of virus-specific cells of CD8+ T cells), determined in ELISPOT assay after stimulation with influenza virus-infected autologous BLCL and with uninfected autologous BLCL, is plotted for each group of donors: group I (HLA-A1, -A2, -B8, -B35), group II (HLA-A1, -A2, -B8, -B27), and group III (HLA-A1, -A3, -B8, -B35). A significant difference (*, P = 0.028) was found between CTLp frequency specific for influenza virus in HLA-A2+, -B27+ donors (group II) compared to that with HLA-A2-negative donors (group III). The box comprises the 25th to 75th percentiles, while the error bars represent the 10th and 90th percentiles from the average CTLp frequency (solid line). Median CTLp frequency is represented by a dotted line. (B) Representation of the contribution of CTLp frequency specific for individual peptides (open bars) to the total influenza virus-specific CTLp frequency (black bars). The percentage of epitope-specific CTLp was calculated for each donor by dividing the sum of the specific spots found for all epitopes by the number of CD8+ T cells within the PBMC (determined by flow cytometry). Results are given as the average percentages of virus-specific CTLp frequency (black bars) calculated from 2 to 3 independently repeated experiments ± SD, whereas the epitope-specific CTLp frequency (open bars) was determined in two independently repeated experiments. Donors 11 and 13 were stimulated with HLA-matched BLCL from donor 10.
FIG. 6.
FIG. 6.
Correlation between CTL activity and influenza virus-specific CTLp frequency. Virus-specific CTL activity was plotted, using influenza virus-infected HLA-matched BLCL at an E:T ratio of 20:1, against the frequency of virus-specific CTLp (presented as the percentage of virus-specific cells of CD8+ T cells) obtained from the ELISPOT assays using influenza virus-infected autologous BLCL. All 18 donors were divided into groups: HLA-A2-negative donors (⋄), HLA-A2-positive, HLA-B27-negative donors (•), and HLA-A2-positive, HLA-B27-positive donors (▴). Two HLA-A2-negative donors (11 and 13) were stimulated with HLA-matched BLCL (donor 10). Donor 8 was excluded from the analysis.

Similar articles

Cited by

References

    1. Badovinac, V. P., A. R. Tvinnereim, and J. T. Harty. 2000. Regulation of antigen-specific CD8(+) T cell homeostasis by perforin and interferon-gamma. Science 290:1354–1358. - PubMed
    1. Bednarek, M. A., S. Y. Sauma, M. C. Gammon, G. Porter, S. Tamhankar, A. R. Williamson, and H. J. Zweerink. 1991. The minimum peptide epitope from the influenza virus matrix protein. Extra and intracellular loading of HLA-A2. J. Immunol. 147:4047–4053. - PubMed
    1. Belz, G. T., J. D. Altman, and P. C. Doherty. 1998. Characteristics of virus-specific CD8(+) T cells in the liver during the control and resolution phases of influenza pneumonia. Proc. Natl. Acad. Sci. USA 95:13812–13817. - PMC - PubMed
    1. Belz, G. T., P. G. Stevenson, and P. C. Doherty. 2000. Contemporary analysis of MHC-related immunodominance hierarchies in the CD8+ T cell response to influenza A viruses. J. Immunol. 165:2404–2409. - PubMed
    1. Belz, G. T., W. Xie, J. D. Altman, and P. C. Doherty. 2000. A previously unrecognized H-2D(b)-restricted peptide prominent in the primary influenza A virus-specific CD8(+) T-cell response is much less apparent following secondary challenge. J. Virol. 74:3486–3493. - PMC - PubMed

Publication types

MeSH terms