. 2002 Jan;76(2):707-16.
doi: 10.1128/jvi.76.2.707-716.2002.

Evidence for human immunodeficiency virus type 1 replication in vivo in CD14(+) monocytes and its potential role as a source of virus in patients on highly active antiretroviral therapy

Affiliations

Evidence for human immunodeficiency virus type 1 replication in vivo in CD14(+) monocytes and its potential role as a source of virus in patients on highly active antiretroviral therapy

Tuofu Zhu et al. J Virol. 2002 Jan.

Abstract

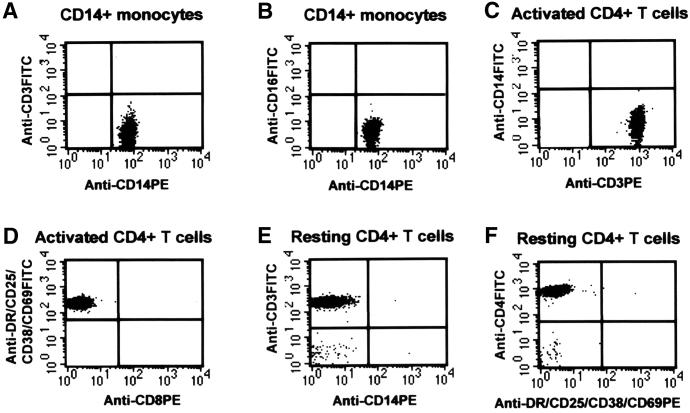
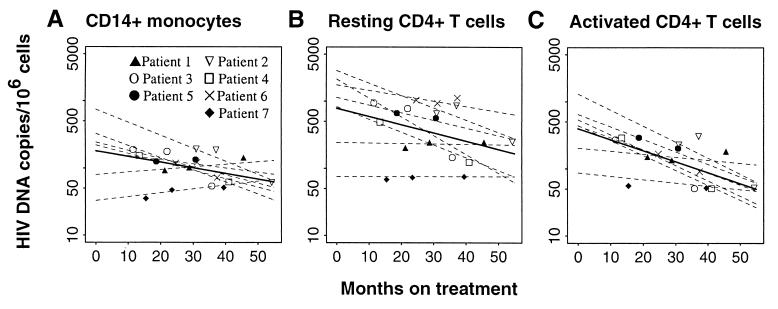
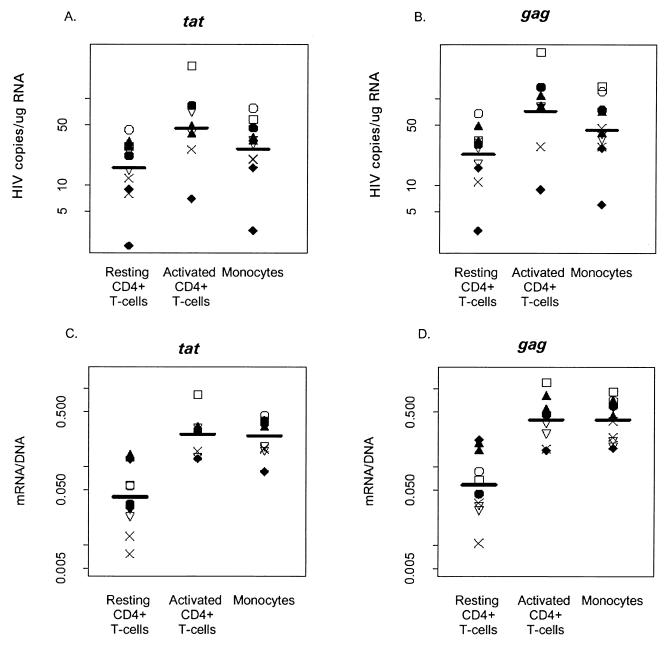
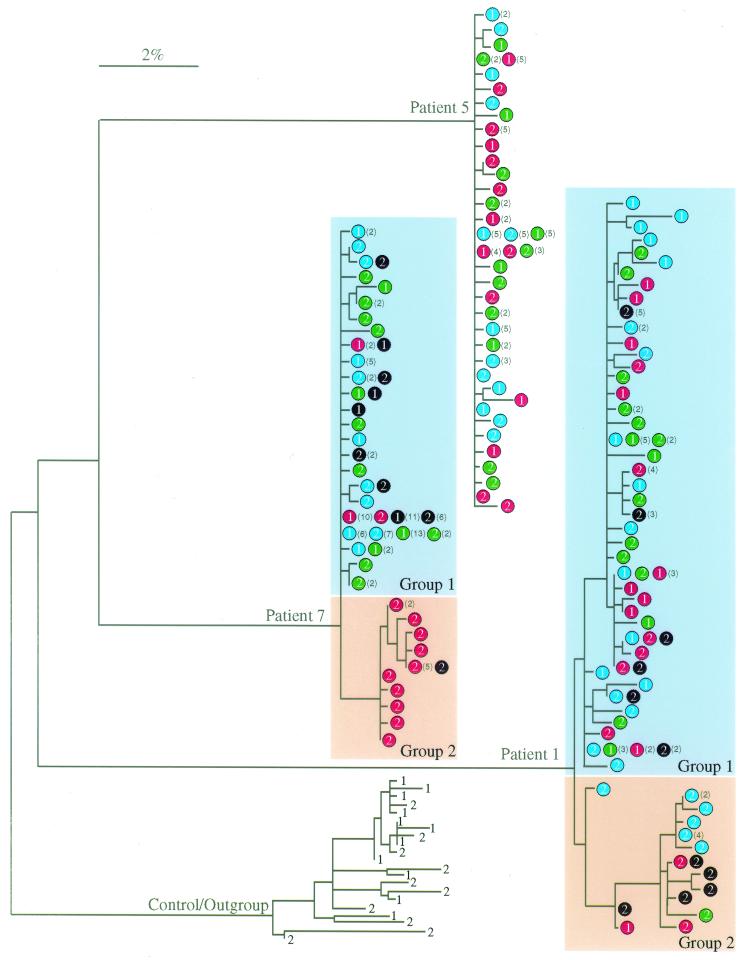
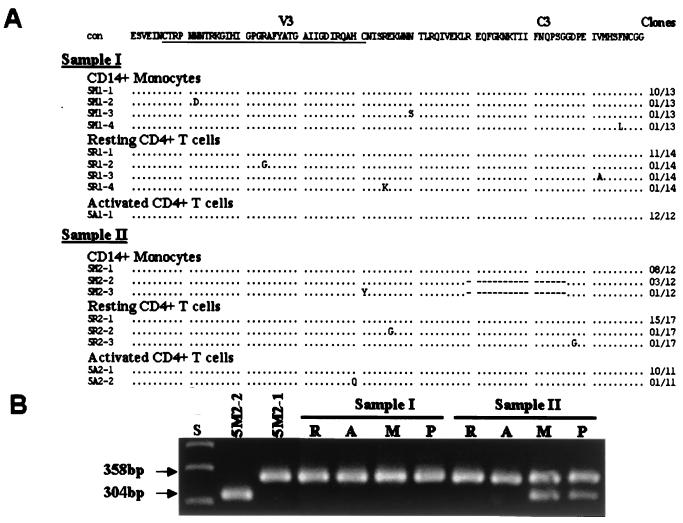
In vitro studies show that human immunodeficiency virus type 1 (HIV-1) does not replicate in freshly isolated monocytes unless monocytes differentiate to monocyte-derived macrophages. Similarly, HIV-1 may replicate in macrophages in vivo, whereas it is unclear whether blood monocytes are permissive to productive infection with HIV-1. We investigated HIV-1 replication in CD14(+) monocytes and resting and activated CD4(+) T cells by measuring the levels of cell-associated viral DNA and mRNA and the genetic evolution of HIV-1 in seven acutely infected patients whose plasma viremia had been <100 copies/ml for 803 to 1,544 days during highly active antiretroviral therapy (HAART). HIV-1 DNA was detected in CD14(+) monocytes as well as in activated and resting CD4(+) T cells throughout the course of study. While significant variation in the decay slopes of HIV-1 DNA was seen among individual patients, viral decay in CD14(+) monocytes was on average slower than that in activated and resting CD4(+) T cells. Measurements of HIV-1 sequence evolution and the concentrations of unspliced and multiply spliced mRNA provided evidence of ongoing HIV-1 replication, more pronounced in CD14(+) monocytes than in resting CD4(+) T cells. Phylogenetic analyses of HIV-1 sequences indicated that after prolonged HAART, viral populations related or identical to those found only in CD14(+) monocytes were seen in plasma from three of the seven patients. In the other four patients, HIV-1 sequences in plasma and the three cell populations were identical. CD14(+) monocytes appear to be one of the potential in vivo sources of HIV-1 in patients receiving HAART.


Figures

FIG. 1.
FIG. 1.
Representative two-color fluorescence analysis of enriched CD14+ monocytes (A and B) and activated (C and D) and resting (E and F) CD4+ T cells. Purified cells were stained either with unconjugated MAb (negative control) or with fluorescein isothiocyanate (FITC)- or phycoerythrin (PE)-conjugated MAb. The purity of CD14+ monocytes obtained by using a combination of negative selection and FACS (see Materials and Methods) was 98.31 to 99.99% (mean ± standard deviation, 99.37% ± 0.58%). There was no contamination of T cells (A) or B cells (B). Activated CD4+ T cells, also purified by both negative selection and FACS for the activation markers HLA-DR, CD25, CD38, and CD69, showed a purity of 98.02 to 99.95% (99.21% ± 0.63%) without CD14+ monocytes (C) and resting CD4+ T cells (D). Resting CD4+ T cells were isolated by negative selection with a 6-day incubation as described previously (7, 10, 15). These cells had undetectable (below the negative control) contamination with CD14+ monocytes (E) and activated CD4+ T cells (F). The unstained cells in the left bottom corner of panels E and F are red blood cells.
FIG. 2.
FIG. 2.
Decay rates of HIV-1 DNA in peripheral blood CD14+ monocytes (A), resting CD4+ T cells (B), and activated CD4+ T cells (C) in seven acutely infected patients taking HAART who had undetectable levels of plasma virus. Patients 1 to 6 had maintained undetectable levels of plasma viremia with one or two episodes of low-level plasma viremia (<100 copies/ml), while patient 7 had consistently maintained plasma HIV-1 RNA at levels lower than 50 copies/ml. Average decay slopes were estimated using linear random-effects regression (12) for one phase decay. The bold line in each panel represents the average slope and intercept of the decay in that cell compartment, and the dashed lines with different symbols represent predicted individual intercepts and decay slopes. The data are summarized in Table 2.
FIG. 3.
FIG. 3.
Comparison of levels of HIV-1 mRNA in CD14+ monocytes and activated CD4+ T cells and resting CD4+ T cells in seven patients following 1 to 3 years of HAART. (A) Levels of MS tat mRNA in the three cell types. Pairwise comparisons of the mean level of the log of tat mRNA using general estimating equations (12) detected significant differences between all three cell types (P < 0.001 for resting compared to activated cells, P < 0.001 for resting cells compared to monocytes, P = 0.003 for activated cells compared to monocytes. (B) Corresponding levels of MS gag mRNA. Again, significant differences were found between all three cell types (P < 0.001 for resting compared to activated cells, P < 0.001 for resting cells compared to monocytes, P = 0.020 for activated cells compared to monocytes). (C) Ratio of HIV-1 tat mRNA to DNA. (D) Ratio of HIV-1 gag mRNA to DNA. Pairwise comparisons of the log of means ratios of both tat and gag mRNA and DNA suggest significant differences between resting CD4+ T cells and both monocytes and activated CD4+ T cells (for both gag and tat, P < 0.001 for resting cells compared to activated cells and monocytes; for tat, P = 0.984 for activated cells compared to monocytes; for gag, P < 0.828 for activated cells compared to monocytes).
FIG. 4.
FIG. 4.
Phylogenetic tree analysis of HIV-1 envelope sequences in CD14+ monocytes (red circles), activated (blue circles) and resting CD4+ T cells (green circles), and plasma (black circles) of patients receiving HAART. The number within each circle is the sample number (i.e., 1 and 2 indicate samples I and II). Numbers in parentheses are the numbers of sequences that were identical in the sample to the left. The outgroup is a patient (46) who was not on therapy but whose samples were obtained over a time frame similar to that of the ingroup. Numbers on these sequences are relative sampling times. The bar indicates genetic distance.
FIG. 5.
FIG. 5.
Comparison of HIV-1 V3-C3 env gp120 sequences in CD14+ monocytes, activated and resting CD4+ T cells, and blood plasma from patient 5. (A) Alignment of deduced amino acid sequences in CD14+ monocytes and activated and resting CD4+ T cells. The consensus sequence (con) is at the top, with the V3 loop underlined. Dots indicate amino acids identical to the consensus sequence; dashes indicate sequence deletions. The numbers of clones with identical sequences are shown on the right. (B) PCR analysis of HIV-1 V3-C3 sequences in CD14+ monocytes (M), activated (A) and resting (R) CD4+ T cells, and blood plasma (P). 5 M2-2 is a minor variant population with the 54-bp deletion; 5 M2-1 is the major population of sequences present in all cell populations and plasma samples. S, size markers.

References

    1. Aquaro, S., C. F. Perno, E. Balestra, J. Balzarini, A. Cenci, A. Bertoli, M. Francesconi, S. Panti, F. Serra, N. Villani, and R. Calio. 1997. Inhibition of replication of HIV in primary monocyte/macrophages by different antiviral drugs and comparative efficacy in lymphocytes. J. Leukoc. Biol. 62:138–143. - PubMed
    1. Aquaro, S., R. Calio, E. Balestra, P. Bagnarelli, A. Cenci, A. Bertoli, B. Tavazzi, D. DiPierro, M. Francesconi, D. Abdelahad, and C. F. Perno. 1998. Clinical implications of HIV dynamics and drug resistance in macrophages. J. Biol. Regul. Homeost. Agents 12(Suppl. 1–2):23–27. - PubMed
    1. Berrey, M. M., T. Schacker, A. C. Collier, T. Shea, S. J. Brodie, D. Mayers, R. Coombs, J. Krieger, T. W. Chun, A. S. Fauci, S. G. Self, and L. Corey. 2001. Treatment of primary human immunodeficiency virus type 1 infection with potent antiretroviral therapy reduces frequency of rapid progression to AIDS. J. Infect. Dis. 183:1466–1475. - PubMed
    1. Blankson, J. N., D. Finzi, T. C. Pierson, B. P. Sabundayo, K. Chadwick, J. B. Margolick, T. C. Quinn, and R. F. Siliciano. 2000. Biphasic decay of latently infected CD4+ T cells in acute human immunodeficiency virus type 1 infection. J. Infect. Dis. 182:1636–1642. - PubMed
    1. Brodie, S. J., B. K. Patterson, D. A. Lewinsohn, K. Diem, D. Spach, P. D. Greenberg, S. R. Riddell, and L. Corey. 2000. HIV-specific cytotoxic T lymphocytes traffic to lymph nodes and localize at sites of HIV replication and cell death. J. Clin. Investig. 105:1407–1417. - PMC - PubMed

Publication types

MeSH terms