

Intracellular localization of the peanut clump virus replication complex in tobacco BY-2 protoplasts containing green fluorescent protein-labeled endoplasmic reticulum or Golgi apparatus
- PMID: 11752175
- PMCID: PMC136813
- DOI: 10.1128/jvi.76.2.865-874.2002
Intracellular localization of the peanut clump virus replication complex in tobacco BY-2 protoplasts containing green fluorescent protein-labeled endoplasmic reticulum or Golgi apparatus
Abstract
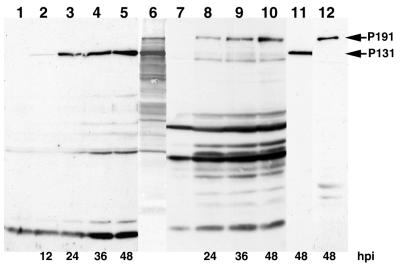
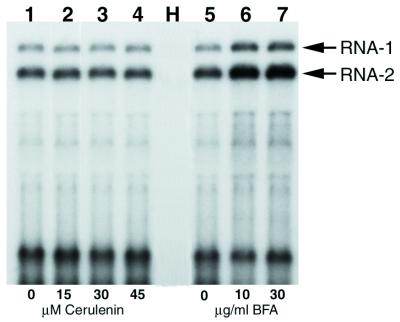
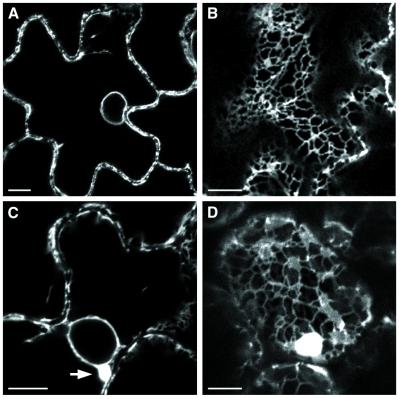
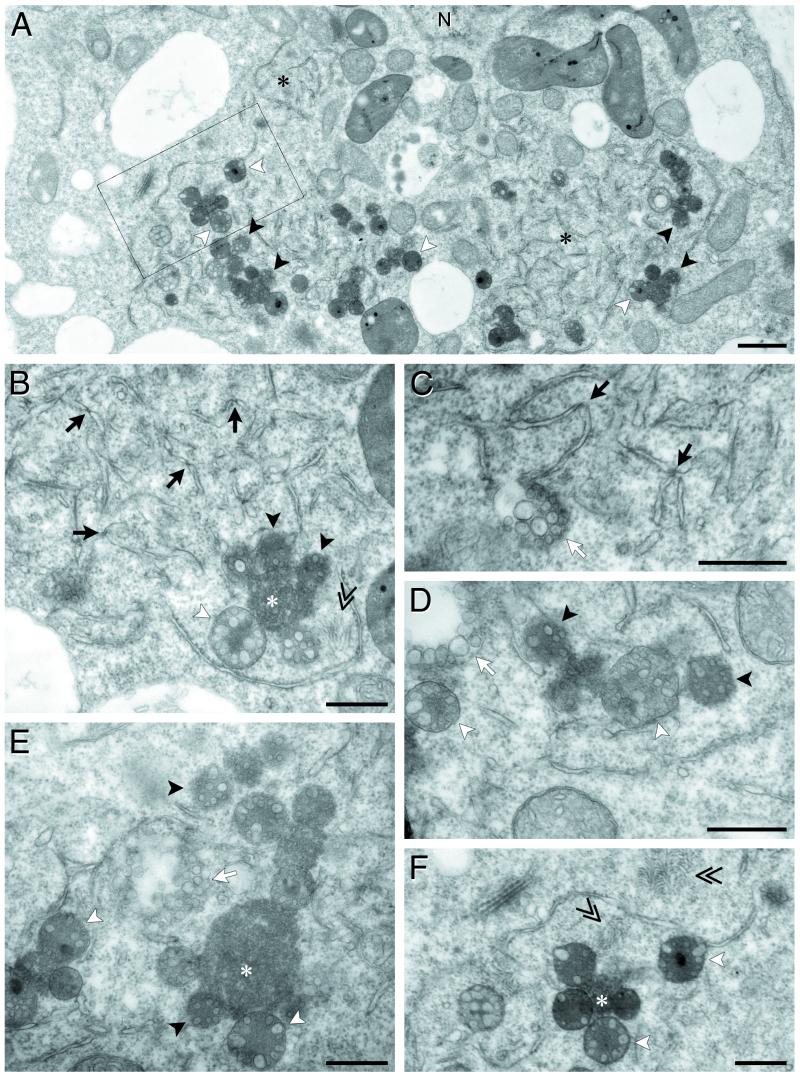
RNA-1 of Peanut clump virus (PCV) encodes the proteins P131 and P191, containing the signature motifs of replication proteins, and P15, which regulates viral RNA accumulation. In PCV-infected protoplasts both P131 and P191 were immunodetected in the perinuclear region. Laser scanning confocal microscopy (LSCM) showed that P131 and P191 colocalized with neosynthesized 5-bromouridine 5'-triphosphate-labeled RNA and double-stranded RNA, demonstrating that they belong to the replication complex. On the contrary, the P15 fused to the enhanced green fluorescent protein (EGFP) never colocalized with the two proteins. In endoplasmic reticulum (ER)-GFP transgenic BY-2 protoplasts, the distribution of the green fluorescent-labeled ER was strongly modified by PCV infection. LSCM showed that both P131 and P191 colocalized with ER green fluorescent bodies accumulating around the nucleus during infection. The replication process was not inhibited by cerulenin and brefeldin A, suggesting that PCV replication does not depend on de novo-synthesized membrane and does not require transport through the Golgi apparatus. Electron microscopy of ultrathin sections of infected protoplasts showed aggregates of broken ER but also visualized vesicles, some of which resembled modified peroxisomes. The results suggest that accumulation of PCV during infection is accompanied by specific association of PCV RNA-1-encoded proteins with membranes of the ER and other organelles. The concomitant extensive rearrangement of these membranous structures leads to the formation of intracellular compartments in which synthesis and accumulation of the viral RNA occur in defined areas.
Figures


Similar articles
-
Peanut clump virus RNA-1-encoded P15 regulates viral RNA accumulation but is not abundant at viral RNA replication sites.J Virol. 2001 Feb;75(4):1941-8. doi: 10.1128/JVI.75.4.1941-1948.2001. J Virol. 2001. PMID: 11160693 Free PMC article.
-
Grapevine fanleaf virus replication occurs on endoplasmic reticulum-derived membranes.J Virol. 2002 Sep;76(17):8808-19. doi: 10.1128/jvi.76.17.8808-8819.2002. J Virol. 2002. PMID: 12163601 Free PMC article.
-
Changing patterns of localization of the tobacco mosaic virus movement protein and replicase to the endoplasmic reticulum and microtubules during infection.Plant Cell. 1998 Jul;10(7):1107-20. doi: 10.1105/tpc.10.7.1107. Plant Cell. 1998. PMID: 9668131 Free PMC article.
-
Host endomembrane recruitment for plant RNA virus replication.Curr Opin Virol. 2012 Dec;2(6):683-90. doi: 10.1016/j.coviro.2012.10.003. Epub 2012 Nov 2. Curr Opin Virol. 2012. PMID: 23123078 Free PMC article. Review.
-
Poxvirus membrane biogenesis.Virology. 2015 May;479-480:619-26. doi: 10.1016/j.virol.2015.02.003. Epub 2015 Feb 26. Virology. 2015. PMID: 25728299 Free PMC article. Review.
Cited by
-
Molecular basis for mitochondrial localization of viral particles during beet necrotic yellow vein virus infection.J Virol. 2005 Aug;79(15):9991-10002. doi: 10.1128/JVI.79.15.9991-10002.2005. J Virol. 2005. PMID: 16014959 Free PMC article.
-
Turnip mosaic virus RNA replication complex vesicles are mobile, align with microfilaments, and are each derived from a single viral genome.J Virol. 2009 Oct;83(20):10460-71. doi: 10.1128/JVI.00819-09. Epub 2009 Aug 5. J Virol. 2009. PMID: 19656892 Free PMC article.
-
Three-Dimensional Architecture and Biogenesis of Membrane Structures Associated with Plant Virus Replication.Front Plant Sci. 2018 Jan 30;9:57. doi: 10.3389/fpls.2018.00057. eCollection 2018. Front Plant Sci. 2018. PMID: 29441085 Free PMC article. Review.
-
Manipulation of the Cellular Membrane-Cytoskeleton Network for RNA Virus Replication and Movement in Plants.Viruses. 2023 Mar 14;15(3):744. doi: 10.3390/v15030744. Viruses. 2023. PMID: 36992453 Free PMC article. Review.
-
Host Subcellular Organelles: Targets of Viral Manipulation.Int J Mol Sci. 2024 Jan 29;25(3):1638. doi: 10.3390/ijms25031638. Int J Mol Sci. 2024. PMID: 38338917 Free PMC article. Review.
References
-
- Appiano, A., G. D’Agostino, M. Bassi, N. Barbieri, G. Viale, and P. Dell’Orto. 1986. Origin and function of tomato bushy stunt virus-induced inclusion bodies. II. Quantitative electron microscope autoradiography and immunogold cytochemistry. J. Ultrastruct. Res. 97:31–38.
-
- Bienz, K., D. Egger, and L. Pasamontes. 1987. Association of polioviral proteins of the P2 genomic region with the viral replication complex and virus-induced membrane synthesis as visualized by electron microscopic immunocytochemistry and autoradiography. Virology 160:220–226. - PubMed
-
- Bienz, K., D. Egger, and T. Pfister. 1994. Characteristics of the poliovirus replication complex. Arch. Virol. Suppl. 9:147–157. - PubMed
-
- Bienz, K., D. Egger, Y. Rasser, and W. Bossart. 1983. Intracellular distribution of poliovirus proteins and the induction of virus-specific cytoplasmic structures. Virology 131:39–48. - PubMed
MeSH terms
Substances
LinkOut - more resources
Full Text Sources
