. 2002 Jan 1;30(1):129-36.
doi: 10.1093/nar/30.1.129.

The Celera Discovery System

Affiliations

The Celera Discovery System

Anthony Kerlavage et al. Nucleic Acids Res. .

Abstract

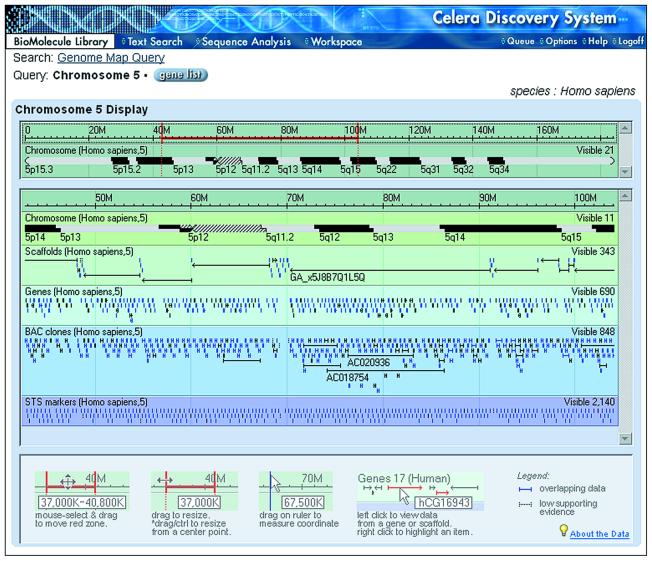
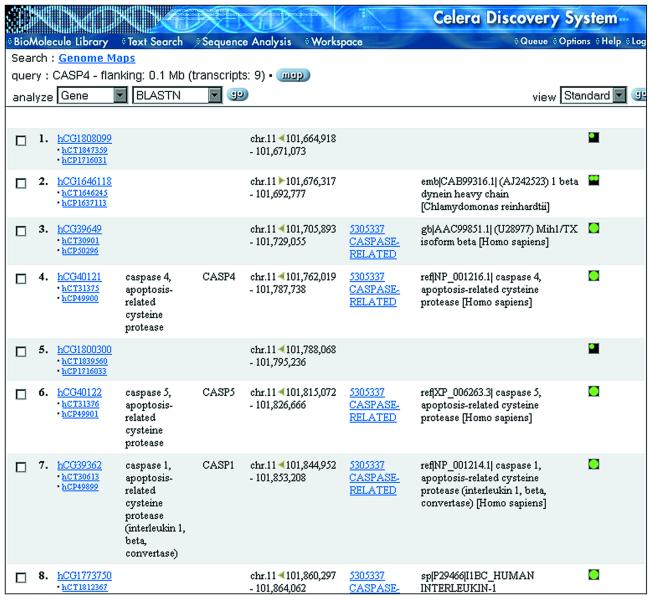
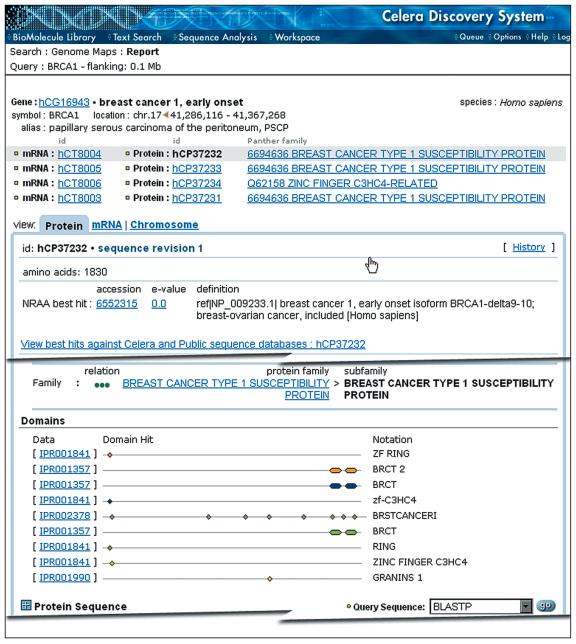
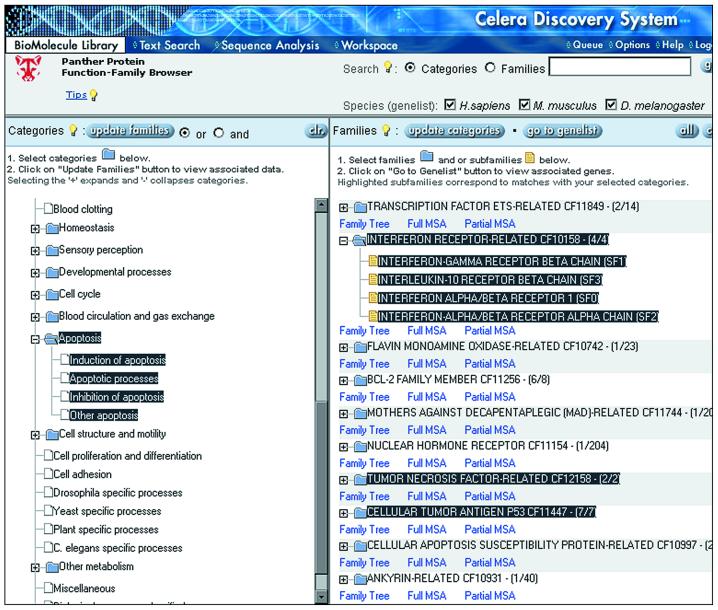
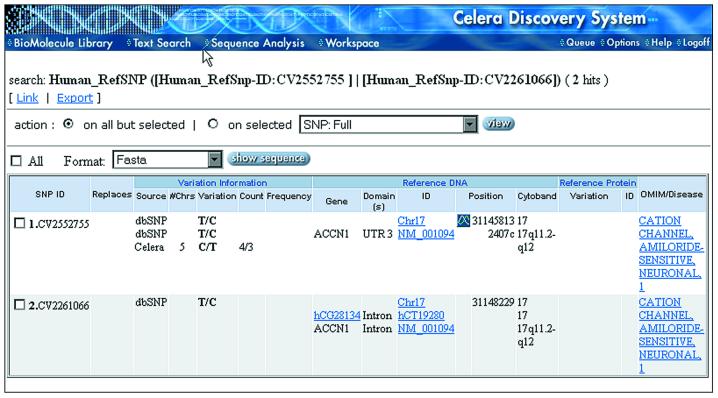
The Celera Discovery System (CDS) is a web-accessible research workbench for mining genomic and related biological information. Users have access to the human and mouse genome sequences with annotation presented in summary form in BioMolecule Reports for genes, transcripts and proteins. Over 40 additional databases are available, including sequence, mapping, mutation, genetic variation, mRNA expression, protein structure, motif and classification data. Data are accessible by browsing reports, through a variety of interactive graphical viewers, and by advanced query capability provided by the LION SRS search engine. A growing number of sequence analysis tools are available, including sequence similarity, pattern searching, multiple sequence alignment and Hidden Markov Model search. A user workspace keeps track of queries and analyses. CDS is widely used by the academic research community and requires a subscription for access. The system and academic pricing information are available at http://cds.celera.com.


Figures

Figure 1
Figure 1
MapView. The MapView applet is divided into two main panels. The upper panel contains a cytogenetic band representation of the entire selected region, a coordinate scale and a pan/zoom bar (red). The lower panel contains a number of panes that represent features contained in the region defined by the pan/zoom bar: cytogenetic bands, scaffolds from Celera’s assembly, identified genes, public BAC clones mapped to Celera’s assembly and STS markers. The number of visible objects in each pane is reported. Holding the mouse cursor over any object reveals its identifier. Clicking on a gene or scaffold takes the user to a gene BioMolecule Report or Scaffold Report, respectively.
Figure 2
Figure 2
Gene List Report. Gene lists can be generated from many places within CDS and display identifiers that link to BioMolecule Reports and other information important to understanding the potential function of the gene product. The protein family assignment links to the Panther Function-Family Browser (Fig. 4). There is an option to view an expanded version of the Gene List, which contains gene aliases and RefSeq and NRAA identifiers with links to GenBank reports.
Figure 3
Figure 3
Representative features from a Protein BioMolecule Report. The report for the BRCA1 gene shows that four alternative splice forms have been identified leading to four protein BioMolecule Reports (hCP37232 shown). The GO classification is not shown for brevity.
Figure 4
Figure 4
Panther Protein Function-Family Browser for exploring the relationship between protein function and sequence. The Panther ontology can be browsed or searched in the left panel. Protein families and/or subfamilies assigned to the selected categories are displayed in the right panel. Families and subfamilies can be also be searched separately and displayed in the right panel. Gene lists can be created by retrieving all proteins assigned to selected families and subfamilies. For each family, links are provided to a distance tree, sequence-level annotation and multiple sequence alignment.
Figure 5
Figure 5
SNP report. The Report displays information such as source (Celera, dbSNP, HGMD), the number of chromosomes sampled, the nucleotide variation, the count and frequency, gene name, structural position, chromosomal location (number, cytogenetic band, scaffold position), links to Celera and RefSeq DNA sequences with location within that sequence, and links to OMIM for disease information associated with the gene. If the SNP is in a coding region, the codon, its position and affected amino acid are displayed. For Celera SNPs, the raw electropherogram data are also available.

References

    1. Velculescu V.E., Zhang,L., Vogelstein,B. and Kinzler,K.W. (1995), Serial analysis of gene expression. Science, 270, 484–487. - PubMed
    1. Brenner S., Johnson,M., Bridgham,J., Golda,G., Lloyd,D.H., Johnson,D., Luo,S., McCurdy,S., Foy,M., Ewan,M. et. al. (2000) Gene expression analysis by massively parallel signature sequencing (MPSS) on microbead arrays. Nat. Biotechnol., 18, 630–634. - PubMed
    1. Venter J.C., Adams,M.D., Myers,E.W., Li,P.W., Mural,R.J., Sutton,G.G., Smith,H.O., Yandell,M., Evans,C.A., Holt,R.A. et. al. (2001) The sequence of the human genome. Science, 291, 1304–1351. - PubMed
    1. Ashburner M., Ball,C.A., Blake,J.A., Botstein,D., Butler,H., Cherry,J.M., Davis,A.P., Dolinski,K., Dwight,S.S., Eppig,J.T. et. al. (2000) Gene Ontology: tool for the unification of biology. Nature Genet., 25, 25–29. - PMC - PubMed
    1. Wingender E., Chen,X., Fricke,E., Geffers,R., Hehl,R., Liebich,I., Krull,M., Matys,V., Michael,H., Ohnhäuser,R. et. al. (2001) The TRANSFAC system on gene expression regulation. Nucleic Acids Res., 29, 281–283. - PMC - PubMed

MeSH terms