

GTOP: a database of protein structures predicted from genome sequences
- PMID: 11752318
- PMCID: PMC99104
- DOI: 10.1093/nar/30.1.294
GTOP: a database of protein structures predicted from genome sequences
Abstract
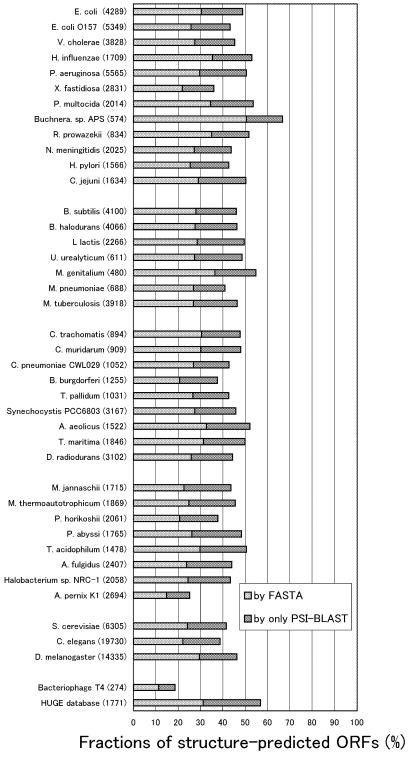
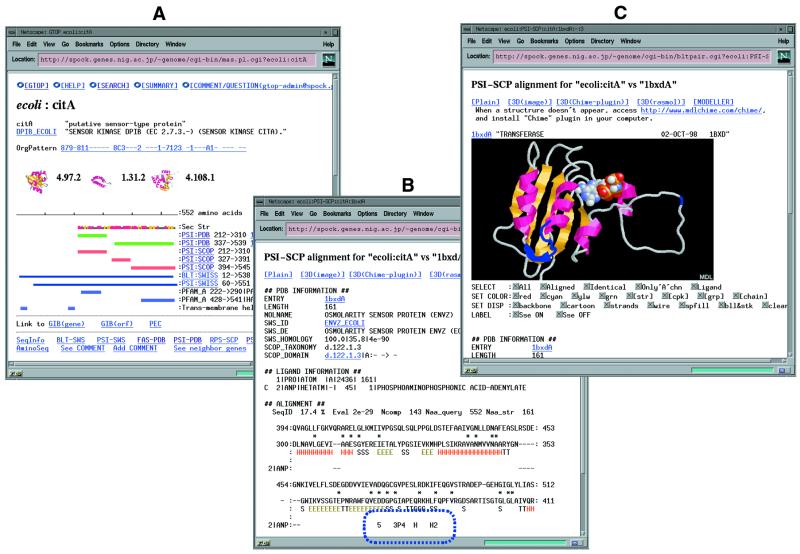
Large-scale genome projects generate an unprecedented number of protein sequences, most of them are experimentally uncharacterized. Predicting the 3D structures of sequences provides important clues as to their functions. We constructed the Genomes TO Protein structures and functions (GTOP) database, containing protein fold predictions of a huge number of sequences. Predictions are mainly carried out with the homology search program PSI-BLAST, currently the most popular among high-sensitivity profile search methods. GTOP also includes the results of other analyses, e.g. homology and motif search, detection of transmembrane helices and repetitive sequences. We have completed analyzing the sequences of 41 organisms, with the number of proteins exceeding 120 000 in total. GTOP uses a graphical viewer to present the analytical results of each ORF in one page in a 'color-bar' format. The assigned 3D structures are presented by Chime plug-in or RasMol. The binding sites of ligands are also included, providing functional information. The GTOP server is available at http://spock.genes.nig.ac.jp/~genome/gtop.html.
Figures
Similar articles
-
The GTOP database in 2009: updated content and novel features to expand and deepen insights into protein structures and functions.Nucleic Acids Res. 2009 Jan;37(Database issue):D333-7. doi: 10.1093/nar/gkn855. Epub 2008 Nov 4. Nucleic Acids Res. 2009. PMID: 18987007 Free PMC article.
-
Enlarged FAMSBASE: protein 3D structure models of genome sequences for 41 species.Nucleic Acids Res. 2003 Jan 1;31(1):463-8. doi: 10.1093/nar/gkg117. Nucleic Acids Res. 2003. PMID: 12520053 Free PMC article.
-
SUPFAM--a database of potential protein superfamily relationships derived by comparing sequence-based and structure-based families: implications for structural genomics and function annotation in genomes.Nucleic Acids Res. 2002 Jan 1;30(1):289-93. doi: 10.1093/nar/30.1.289. Nucleic Acids Res. 2002. PMID: 11752317 Free PMC article.
-
[Protein structure information provided by the GTOP database and its applications].Tanpakushitsu Kakusan Koso. 2002 Jun;47(8 Suppl):1076-82. Tanpakushitsu Kakusan Koso. 2002. PMID: 12099026 Review. Japanese. No abstract available.
-
Predicting structures for genome proteins.Curr Opin Struct Biol. 1999 Apr;9(2):208-11. doi: 10.1016/S0959-440X(99)80029-3. Curr Opin Struct Biol. 1999. PMID: 10322219 Review.
Cited by
-
Translationally optimal codons associate with structurally sensitive sites in proteins.Mol Biol Evol. 2009 Jul;26(7):1571-80. doi: 10.1093/molbev/msp070. Epub 2009 Apr 6. Mol Biol Evol. 2009. PMID: 19349643 Free PMC article.
-
Coverage of whole proteome by structural genomics observed through protein homology modeling database.J Struct Funct Genomics. 2006 Jun;7(2):65-76. doi: 10.1007/s10969-006-9010-3. Epub 2006 Dec 5. J Struct Funct Genomics. 2006. PMID: 17146617 Free PMC article.
-
Dual pathways of tRNA hydroxylation ensure efficient translation by expanding decoding capability.Nat Commun. 2019 Jun 28;10(1):2858. doi: 10.1038/s41467-019-10750-8. Nat Commun. 2019. PMID: 31253794 Free PMC article.
-
Differences in dinucleotide frequencies of thermophilic genes encoding water soluble and membrane proteins.J Zhejiang Univ Sci B. 2011 Jun;12(6):419-27. doi: 10.1631/jzus.B1000331. J Zhejiang Univ Sci B. 2011. PMID: 21634034 Free PMC article.
-
VarySysDB: a human genetic polymorphism database based on all H-InvDB transcripts.Nucleic Acids Res. 2009 Jan;37(Database issue):D810-5. doi: 10.1093/nar/gkn798. Epub 2008 Oct 25. Nucleic Acids Res. 2009. PMID: 18953038 Free PMC article.
References
-
- Park J., Karplus,K., Barret,C., Hughey,R., Haussler,D., Hubbard,T. and Chothia,C. (1998) Sequence comparison using multiple sequences detect three times as many homologues as pairwise methods. J. Mol. Biol., 284, 1201–1210. - PubMed
-
- Wolf Y.I., Brenner,S.E., Bash,P.A. and Koonin,E.V. (1999) Distribution of protein folds in the three superkingdoms of life. Genome Res., 9, 17–26. - PubMed
-
- Teichmann S.A., Chothia,C. and Gerstein,M. (1999) Advances in structural genomics. Curr. Opin. Struct. Biol., 9, 390–399. - PubMed
-
- Burley S.K. (2001) An overview of structural genomics. Nature Struct. Biol., 7 (suppl.), 932–934. - PubMed
Publication types
MeSH terms
Substances
LinkOut - more resources
Full Text Sources
Other Literature Sources
Research Materials
