

doi: 10.1073/pnas.012608399.
Epub 2001 Dec 18.
Sequence analysis of mouse vomeronasal receptor gene clusters reveals common promoter motifs and a history of recent expansion
Affiliations
- PMID: 11752409
- PMCID: PMC117554
- DOI: 10.1073/pnas.012608399
Item in Clipboard
Sequence analysis of mouse vomeronasal receptor gene clusters reveals common promoter motifs and a history of recent expansion
Proc Natl Acad Sci U S A.
.
Abstract
We have analyzed the organization and sequence of 73 V1R genes encoding putative pheromone receptors to identify regulatory features and characterize the evolutionary history of the V1R family. The 73 V1Rs arose from seven ancestral genes around the time of mouse-rat speciation through large local duplications, and this expansion may contribute to speciation events. Orthologous V1R genes appear to have been lost during primate evolution. Exceptional noncoding homology is observed across four V1R subfamilies at one cluster and thus may be important for locus-specific transcriptional regulation.
Figures


Molecular tree illustrates local gene expansion. Unrooted
paup (Sinauer Associates, Sunderland, MA) nucleotide
distance tree of 44 V1R genes with ORFs from three chromosomal
locations. The tree partitions into three monophyletic clades: one that
contains all 16 V1R ORFs from the 6D locus, another that contains all
23 V1R ORFs from second region on chromosome 6 (6.56/6.67), and the
third that contains all 5 V1R ORFs from the chromosome 13 BAC. Seven
subfamilies (>25% nucleotide divergence in coding sequence) are
color-coded: A subfamily, red; B subfamily, green; a7-a8 subfamily,
yellow; a9 gene, unshaded; NC/BD/BC, blue (with BC subclade in
light blue to reflect the distinct map location of this gene set); and
the two chromosome 13 subfamilies, light and dark gray. Nomenclature is
described in Methods.
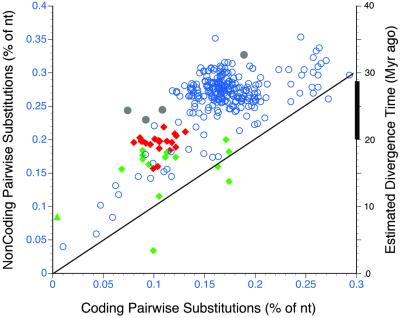
Pairwise sequence divergence for noncoding and coding regions of
duplicated V1R gene blocks. The duplicated blocks were compared within
six of the seven V1R subfamilies (a9 is excluded, because it has not
duplicated). The average size of the noncoding/nonrepeat portions of
these blocks is 3.5 kb. All possible alignment combinations (293 pairs)
of duplicated blocks containing V1R ORFs were analyzed for percent
substitution. The resulting pairwise nucleotide divergence of the
noncoding portions of the blocks is plotted versus the nucleotide
divergence of the V1R coding sequences within the blocks. The right
axis converts percent divergence into time, using a molecular clock
rate of 0.5%/million years (Myr) for noncoding rodent
sequences. The thicker black line between 20–29 Myr indicates the
approximate date of mouse–rat speciation (36). The 252 possible
comparisons of the NC/BD/BC subfamily (23 genes) are plotted as
open blue circles, the 15 possible comparisons of the A-subfamily
blocks (six genes) are plotted as red diamonds, the 21 possible
comparisons of the B-subfamily blocks (seven genes) are plotted as
green diamonds, the V1ra7-V1ra8 comparison (two genes)
is plotted as a green triangle, and the three
13.3–13.4–13.8 (three genes) comparisons and the
13.6–13.9 comparison (two genes) are plotted as
gray circles.

Common V1R promoter homology at the chromosome 6D locus. The common
promoter regions of the 15 V1R genes with ORFs from the chromosome 6D
locus are aligned (these regions correspond to the purple-shaded
regions in Fig. 1A). The 15 V1R genes belong to
four divergent subfamilies separated by lines. Identities are shaded
black; nucleotide positions shared by at least three V1Rs are shaded
gray. See Fig. 9, which is published as supporting information on the
PNAS web site, for an enlarged version of this figure.
Similar articles
-
V1R promoters are well conserved and exhibit common putative regulatory motifs.BMC Genomics. 2007 Jul 25;8:253. doi: 10.1186/1471-2164-8-253. BMC Genomics. 2007. PMID: 17651493 Free PMC article.
-
Identification of V1R-like putative pheromone receptor sequences in non-human primates. Characterization of V1R pseudogenes in marmoset, a primate species that possesses an intact vomeronasal organ.Chem Senses. 2002 Jul;27(6):529-37. doi: 10.1093/chemse/27.6.529. Chem Senses. 2002. PMID: 12142329
-
Dynamic evolution of V1R putative pheromone receptors between Mus musculus and Mus spretus.BMC Genomics. 2009 Feb 9;10:74. doi: 10.1186/1471-2164-10-74. BMC Genomics. 2009. PMID: 19203383 Free PMC article.
-
Evolution of V1R pheromone receptor genes in vertebrates: diversity and commonality.Genes Genet Syst. 2019 Oct 30;94(4):141-149. doi: 10.1266/ggs.19-00009. Epub 2019 Oct 2. Genes Genet Syst. 2019. PMID: 31474650 Review.
-
Expression of candidate pheromone receptor genes in vomeronasal neurons.Chem Senses. 1998 Aug;23(4):467-75. doi: 10.1093/chemse/23.4.467. Chem Senses. 1998. PMID: 9759535 Review.
Cited by
-
Species specificity in rodent pheromone receptor repertoires.Genome Res. 2004 Apr;14(4):603-8. doi: 10.1101/gr.2117004. Genome Res. 2004. PMID: 15060001 Free PMC article.
-
Atypical expansion in mice of the sensory neuron-specific Mrg G protein-coupled receptor family.Proc Natl Acad Sci U S A. 2003 Aug 19;100(17):10043-8. doi: 10.1073/pnas.1732949100. Epub 2003 Aug 8. Proc Natl Acad Sci U S A. 2003. PMID: 12909716 Free PMC article.
-
Olfactory expression of a single and highly variable V1r pheromone receptor-like gene in fish species.Proc Natl Acad Sci U S A. 2005 Apr 12;102(15):5489-94. doi: 10.1073/pnas.0402581102. Epub 2005 Apr 4. Proc Natl Acad Sci U S A. 2005. PMID: 15809442 Free PMC article.
-
Comparative Genomic Analysis of the Pheromone Receptor Class 1 Family (V1R) Reveals Extreme Complexity in Mouse Lemurs (Genus, Microcebus) and a Chromosomal Hotspot across Mammals.Genome Biol Evol. 2020 Jan 1;12(1):3562-3579. doi: 10.1093/gbe/evz200. Genome Biol Evol. 2020. PMID: 31555816 Free PMC article.
-
Comparative genomic analysis identifies an evolutionary shift of vomeronasal receptor gene repertoires in the vertebrate transition from water to land.Genome Res. 2007 Feb;17(2):166-74. doi: 10.1101/gr.6040007. Epub 2007 Jan 8. Genome Res. 2007. PMID: 17210926 Free PMC article.
References
-
- Keverne E B. Science. 1999;286:716–720. - PubMed
-
- Krieger J, Schmitt A, Lobel D, Gudermann T, Schultz G, Breer H, Boekhoff I. J Biol Chem. 1999;274:4655–4662. - PubMed
-
- Aujard F. Physiol Behav. 1997;62:1003–1008. - PubMed
-
- Curtis J T, Liu Y, Wang Z. Brain Res. 2001;901:167–174. - PubMed
-
- Buck L, Axel R. Cell. 1991;65:165–187. - PubMed
Publication types
MeSH terms
Substances
Associated data
- Actions
Grants and funding
LinkOut - more resources
Full Text Sources
Molecular Biology Databases
