. 2002 Jan 8;99(1):377-82.
doi: 10.1073/pnas.012611099. Epub 2001 Dec 18.

Optical imaging of Renilla luciferase reporter gene expression in living mice

Affiliations

Optical imaging of Renilla luciferase reporter gene expression in living mice

S Bhaumik et al. Proc Natl Acad Sci U S A. .

Abstract

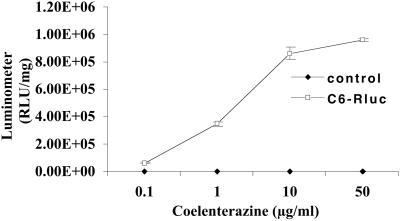
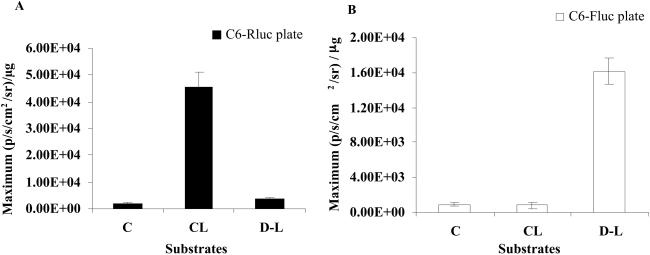
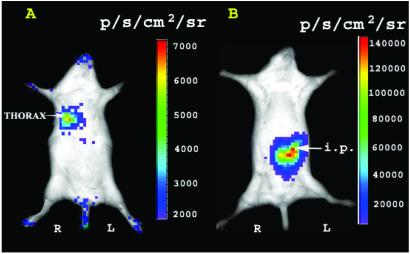
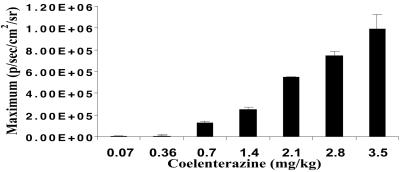
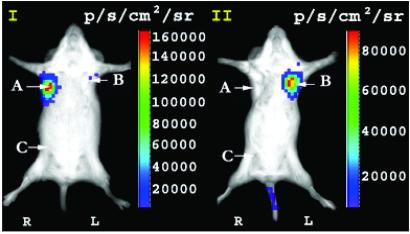
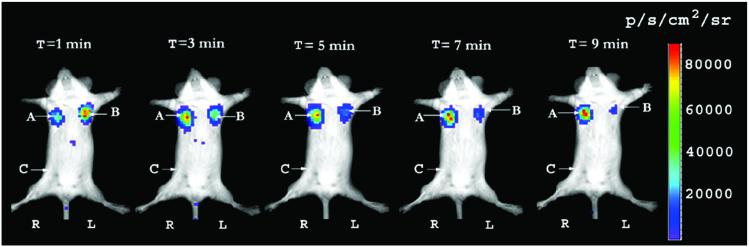
Imaging reporter gene expression in living subjects is a rapidly evolving area of molecular imaging research. Studies have validated the use of reporter genes with positron emission tomography (PET), single photon emission computed tomography (SPECT), MRI, fluorescence with wild-type and mutants of green fluorescent protein, as well as bioluminescence using Firefly luciferase enzyme/protein (FL). In the current study, we validate for the first time the ability to image bioluminescence from Renilla luciferase enzyme/protein (RL) by injecting the substrate coelenterazine in living mice. A highly sensitive cooled charge-coupled device camera provides images within a few minutes of photon counting. Cells, transiently expressing the Rluc were imaged while located in the peritoneum, s.c. layer, as well as in the liver and lungs of living mice tail-vein injected with coelenterazine. Furthermore, d-luciferin (a substrate for FL) does not serve as a substrate for RL, and coelenterazine does not serve as a substrate for FL either in cell culture or in living mice. We also show that both Rluc and Fluc expression can be imaged in the same living mouse and that the kinetics of light production are distinct. The approaches validated will have direct applications to various studies where two molecular events need to be tracked, including cell trafficking of two cell populations, two gene therapy vectors, and indirect monitoring of two endogenous genes through the use of two reporter genes.


Figures

Figure 1
Figure 1
Kinetics of light production with C6-Rluc and C6 cell extracts exposed to coelenterazine. The graph shows a peak signal within the first 10 s that goes down steadily for next 10 min. The values plotted were integrated every 10 s. Control C6 cells do not show any significant signal. The values are normalized to mg of total protein. The error bars represents standard error of mean (SEM) of triplicates.
Figure 2
Figure 2
Effects of coelenterazine dose on measured light from C6-Rluc and control C6 cell lysates. A dose range of 0.1–50 μg/ml coelenterazine produces a maximum of 9.6 × 10⁵ ± 1.1 × 10⁴ RLU/mg, as measured in the luminometer. A near linear increase with dose is observed between 0.1–10 μg/ml, with some plateauing between 10–50 μg/ml. Control C6 cell lysates do not show any significant signal. The signal from C6-Rluc cell lysates is significantly different (P < 0.05) from control with a dose as low as 0.1 μg/ml. The values are from triplicate wells normalized to mg protein. The error bar represents SEM.
Figure 3
Figure 3
Crossreactivity of d-luciferin with RL and coelenterazine with FL in cell culture. (A) The wells with C6-Rluc cells show bioluminescence with coelenterazine (CL) and not with d-luciferin (D-L). (B) The C6-Fluc cells showed bioluminescence with d-luciferin (D-L), whereas CL produces no significant signal from these cells. Control cells, untreated with substrate, show negligible signal in both. All RLU values are normalized to μg of total protein. The error bar represents the SEM for triplicate wells.
Figure 4
Figure 4
RL bioluminescence from C6-Rluc cells present in various tissues in living mice. (A) The C6-Rluc cells (1.0 × 10⁶) were injected via tail-vein and coelenterazine was tail-vein injected 90 min later. The bioluminescence seen represents the thorax region of the mouse where C6-Rluc cells are trapped in the lungs. (B) C6-Rluc cells (1.0 × 10⁶) were implanted in the peritoneum of a different mouse and coelenterazine was tail-vein injected immediately. Bioluminescence is seen only from the i.p. region. R and L represent the right and left side of the mouse resting in supine position.
Figure 5
Figure 5
RL bioluminescence in living mice depends on the dose of coelenterazine injected. A dose range of coelenterazine from 0.07–3.5 mg/kg body weight was injected via tail-vein in two mice s.c. implanted with C6-Rluc cells. The ROI signal increases as a function of higher coelenterazine dose. The error bar represents mean ± SEM.
Figure 6
Figure 6
Crossreactivity of RL for d-luciferin and FL for coelenterazine in living mice. Both C6-Fluc (A) and C6-Rluc (B) cells were implanted s.c. at right forearm and left forearm sites respectively in the same mouse with control C6 cell (C) implanted in the right thigh region. Injection of d-luciferin via tail-vein in the mouse I shows bioluminescence from site A and minimal signal from the B and C sites. Injection of coelenterazine via tail-vein in mouse II produce bioluminescence from site B but minimal signal from the A or C sites. R and L represent the right and left side of the mouse resting in supine position.
Figure 7
Figure 7
Kinetics of light production from mice carrying s.c. C6-Fluc and C6-Rluc cells after simultaneous tail-vein injection of both d-luciferin and coelenterazine. A mouse was injected s.c. with C6-Fluc (A), C6-Rluc (B), and C6 control cells (C) on right forearm, left forearm, and right thigh regions, respectively. Simultaneous injection of both coelenterazine and d-luciferin mixture via tail-vein shows bioluminescence from both the sites simultaneously but with distinct kinetics. A series of image at 2-min intervals is shown from the same mouse. Each image represents a scan time of 1 min. The signal from C6-Rluc cells (B) peaks early and is near extinguished within 10 min. Bioluminescence from C6-Fluc cells (A) shows a relatively strong signal beyond 10 min. The region of control cells does not show any significant bioluminescence. R and L represent the right and left side of the mouse resting in supine position.

Similar articles

Cited by

References

    1. Ray P, Bauer E, Iyer M, Barrio J R, Satyamurthy N, Phelps M E, Herschman H R, Gambhir S. Semin Nucl Med. 2001;31:321–320. - PubMed
    1. Bremer C, Weissleder R. Acad Radiol. 2001;8:15–23. - PubMed
    1. Contag C H, Spilman S D, Contag P R, Oshiro M, Eames B, Dennery P, Stevenson D K, Benaron D A. Photochem Photobiol. 1997;66:523–531. - PubMed
    1. Contag P R, Olomu I N, Stevenson D K, Contag C H. Nat Med. 1998;4:245–247. - PubMed
    1. Lipshutz G S, Gruber C A, Cao Y, Hardy J, Contag C H, Gaensler K M L. Mol Ther. 2001;3:284–292. - PubMed

Publication types

LinkOut - more resources