

Evidence for a NOD2-independent susceptibility locus for inflammatory bowel disease on chromosome 16p
- PMID: 11752413
- PMCID: PMC117559
- DOI: 10.1073/pnas.261567999
Evidence for a NOD2-independent susceptibility locus for inflammatory bowel disease on chromosome 16p
Abstract
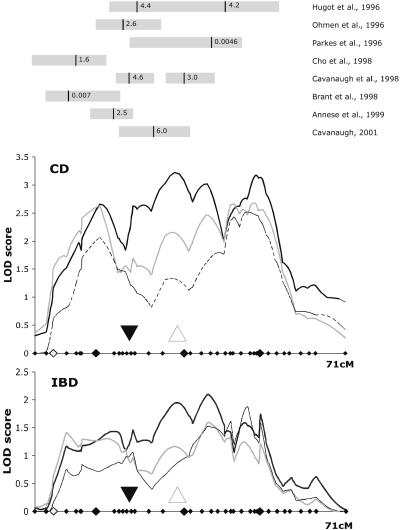
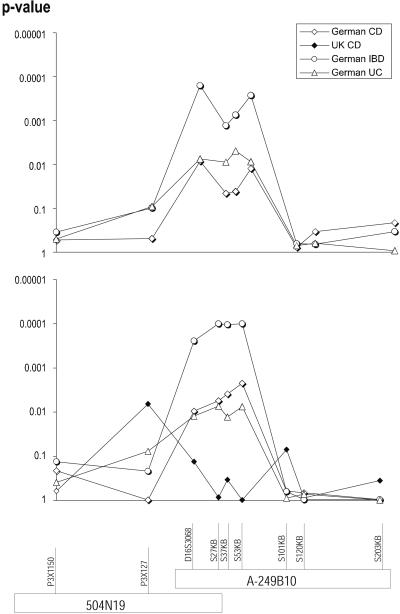
Heritable predisposition to inflammatory bowel disease (IBD) has been demonstrated by epidemiological and genetic analysis. Linkage of IBD to broad regions of chromosome 16 has been established by analysis of multiple populations. NOD2, located on proximal 16q, was recently identified as an IBD gene. As the linkage regions on chromosome 16 are large, we have investigated the possibility that NOD2 is not the only IBD gene located on this chromosome. A high-density experiment using 39 microsatellite markers was performed to identify additional regions of association, and to indicate areas of interest for further investigation. A triple-peaked configuration of the linkage curve with peak logarithm of odds (lod) scores of 2.7, 3.2, and 3.1 was observed on proximal 16p, proximal 16q, and central 16q, respectively. The cohort was stratified by coding individuals carrying the NOD2 single nucleotide polymorphism (SNP)8 and SNP13 "unknown." Significance at the central peak, corresponding to the genomic location of NOD2, then decreased from 3.2 to 1.2. The maximal lod scores on the proximal p-arm (lod = 2.1) and central q-arm (lod = 2.6) changed only moderately. An exploratory association analysis (TRANSMIT) yielded a strong lead at D16S3068 (P = 0.00028). The region around this marker was further investigated by using anonymous SNPs. An associated haplotype containing three SNPs was identified (peak significance P = 0.00027, IBD phenotype). On stratification based on NOD2 genotype, this significance increased to P = 0.0001. These results confirm the importance of NOD2 and provide evidence for a second IBD gene located on chromosome 16p.
Figures
Similar articles
-
Stratification by CARD15 variant genotype in a genome-wide search for inflammatory bowel disease susceptibility loci.Hum Genet. 2003 Nov;113(6):514-21. doi: 10.1007/s00439-003-1020-7. Epub 2003 Sep 13. Hum Genet. 2003. PMID: 13680363
-
Association of NOD2 with Crohn's disease in a homogenous Irish population.Eur J Hum Genet. 2003 Mar;11(3):237-44. doi: 10.1038/sj.ejhg.5200954. Eur J Hum Genet. 2003. PMID: 12673278
-
Fine mapping of the chromosome 3p susceptibility locus in inflammatory bowel disease.Gut. 2001 Feb;48(2):191-7. doi: 10.1136/gut.48.2.191. Gut. 2001. PMID: 11156639 Free PMC article.
-
Progress in searching for susceptibility gene for inflammatory bowel disease by positional cloning.World J Gastroenterol. 2003 Aug;9(8):1646-56. doi: 10.3748/wjg.v9.i8.1646. World J Gastroenterol. 2003. PMID: 12918095 Free PMC article. Review.
-
The genetics of inflammatory bowel disease.Gastroenterology. 2003 Feb;124(2):521-36. doi: 10.1053/gast.2003.50045. Gastroenterology. 2003. PMID: 12557156 Review.
Cited by
-
Stratification by CARD15 variant genotype in a genome-wide search for inflammatory bowel disease susceptibility loci.Hum Genet. 2003 Nov;113(6):514-21. doi: 10.1007/s00439-003-1020-7. Epub 2003 Sep 13. Hum Genet. 2003. PMID: 13680363
-
Genotype and phenotype relation in inflammatory bowel disease.J Gastroenterol. 2005 Mar;40 Suppl 16:21-4. doi: 10.1007/BF02990574. J Gastroenterol. 2005. PMID: 15902959
-
NOD-like receptors and inflammation.Arthritis Res Ther. 2008;10(6):228. doi: 10.1186/ar2525. Epub 2008 Nov 25. Arthritis Res Ther. 2008. PMID: 19090963 Free PMC article. Review.
-
Paneth cell alpha-defensins: peptide mediators of innate immunity in the small intestine.Springer Semin Immunopathol. 2005 Sep;27(2):133-46. doi: 10.1007/s00281-005-0202-x. Epub 2005 Jun 2. Springer Semin Immunopathol. 2005. PMID: 15931529 Review.
-
Tumour necrosis factor-alpha production stimulated by heat shock protein 70 and its inhibition in circulating dendritic cells and cells eluted from mucosal tissues in Crohn's disease.Clin Exp Immunol. 2006 Mar;143(3):550-9. doi: 10.1111/j.1365-2249.2006.03010.x. Clin Exp Immunol. 2006. PMID: 16487255 Free PMC article.
References
-
- Probert C S, Jayanthi V, Rampton D S, Mayberry J F. Int J Colorectal Dis. 1996;11:25–28. - PubMed
-
- Yamamoto T, Keighley M R. Int J Colorectal Dis. 2000;15:211–215. - PubMed
-
- Sabir N, Sungurtekin U, Erdem E, Nessar M. Int J Colorectal Dis. 2000;15:317–322. - PubMed
-
- Voigt E, Griga T, Tromm A, Henschel M G, Vorgerd M, May B. Int J Colorectal Dis. 1999;14:304–307. - PubMed
Publication types
MeSH terms
Substances
Grants and funding
LinkOut - more resources
Full Text Sources
Other Literature Sources
Molecular Biology Databases
Research Materials
