. 2001 Dec 18;98(26):14778-83.
doi: 10.1073/pnas.261553698.

Trends of measured climate forcing agents

Affiliations

Trends of measured climate forcing agents

J E Hansen et al. Proc Natl Acad Sci U S A. .

Abstract

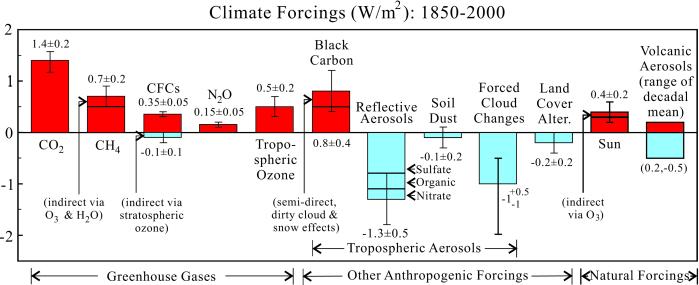
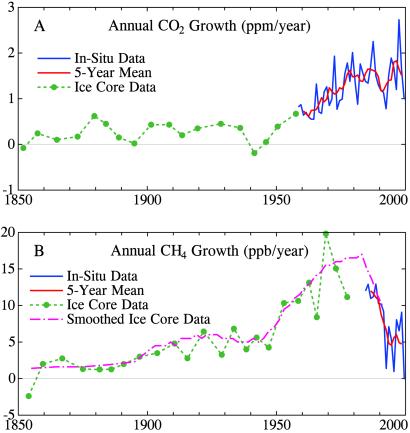
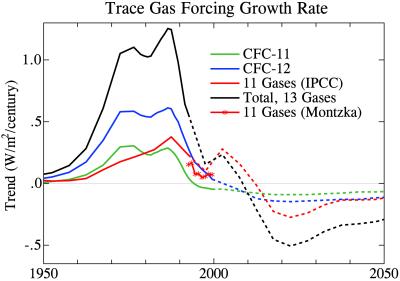
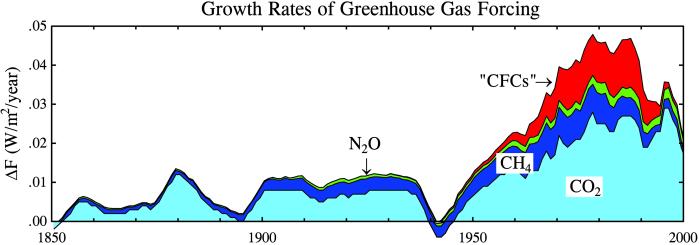
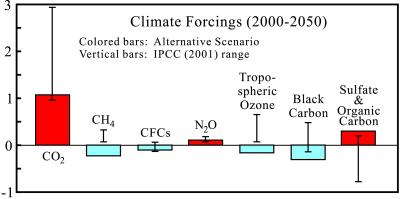
The growth rate of climate forcing by measured greenhouse gases peaked near 1980 at almost 5 W/m(2) per century. This growth rate has since declined to approximately 3 W/m(2) per century, largely because of cooperative international actions. We argue that trends can be reduced to the level needed for the moderate "alternative" climate scenario ( approximately 2 W/m(2) per century for the next 50 years) by means of concerted actions that have other benefits, but the forcing reductions are not automatic "co-benefits" of actions that slow CO(2) emissions. Current trends of climate forcings by aerosols remain very uncertain. Nevertheless, practical constraints on changes in emission levels suggest that global warming at a rate +0.15 +/- 0.05 degrees C per decade will occur over the next several decades.


Figures

Figure 1
Figure 1
Estimated climate forcings; error bars are partly subjective 1σ uncertainties.
Figure 2
Figure 2
Growth rate of atmospheric CO2 and CH4 based on ice core measurements of Etheridge et al. (20, 21), in situ CO2 observations initiated by C. D. Keeling (11), and National Oceanic and Atmospheric Administration (NOAA) CO2 and CH4 observations made available by the NOAA Climate Monitoring and Diagnostics Laboratory (ftp://ftp.cmdl.noaa.gov/ccg).
Figure 3
Figure 3
Growth rate of climate forcing for gases controlled by the Montreal Protocol (CFC-11, CFC-12, CFC-113, CFC-114, CFC-115, CCl4, CH3CCl3, HCFC-22, HCFC-141b, HCFC-142b, HCFC-123, CF2BrCl, CF3Br) based on IPCC (appendix II of ref. 3), National Oceanic and Atmospheric Administration Climate Monitoring and Diagnostics Laboratory Global Flask Network (ftp://ftp.cmdl.noaa.gov/hats/), and data from Montzka et al. (26).
Figure 4
Figure 4
Growth rate of climate forcing by well-mixed greenhouse gases (5-year mean, except 3-year mean for 1999 and 1-year mean for 2000). O3 and stratospheric H2O, which were not well measured, are not included.
Figure 5
Figure 5
CO2 emissions based on data of Marland and Boden (27).
Figure 6
Figure 6
U.S. percentage of global fossil fuel CO2 emissions (27).
Figure 7
Figure 7
Climate forcing scenario for 2000–2050 that yields a forcing of 0.85 W/m2 (colored bars), including small forcings from stratospheric ozone recovery and trace gases (Table 1).

Similar articles

Cited by

References

    1. Hansen J, Ruedy R, Sato M, Imhoff M, Lawrence W, Easterling D, Peterson T, Karl T. J Geophys Res. 2001;106:23947–23963.
    1. Jones P D, New M, Parker D E, Martin S, Rigor I G. Rev Geophys. 1999;37:173–199.
    1. Houghton J T, Ding Y, Griggs D J, Noguer M, van der Linden P J, Dai X, Maskell K, Johnson C A, editors. Intergovernmental Panel on Climate Change. Climate Change 2001. Cambridge, U.K.: Cambridge Univ. Press; 2001.
    1. Hansen J, Sato M, Ruedy R. J Geophys Res. 1997;102:6831–6864.
    1. Hansen J, Sato M, Ruedy R, Lacis A, Oinas V. Proc Natl Acad Sci USA. 2000;97:9875–9880. . (First Published August 15, 2000; 10.1073/pnas.170278997) - PMC - PubMed

LinkOut - more resources