

Tumor induction by an Lck-MyrAkt transgene is delayed by mechanisms controlling the size of the thymus
- PMID: 11752445
- PMCID: PMC64967
- DOI: 10.1073/pnas.231467698
Tumor induction by an Lck-MyrAkt transgene is delayed by mechanisms controlling the size of the thymus
Abstract
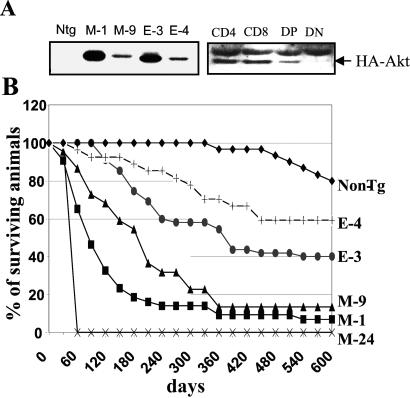
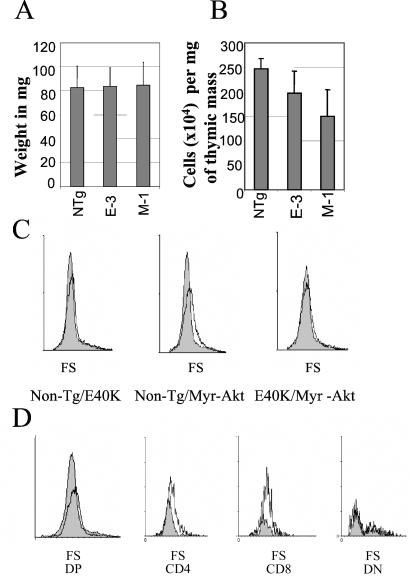
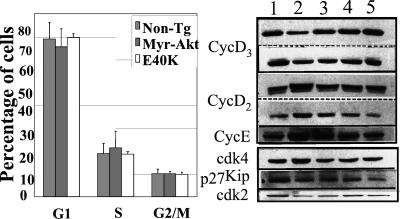
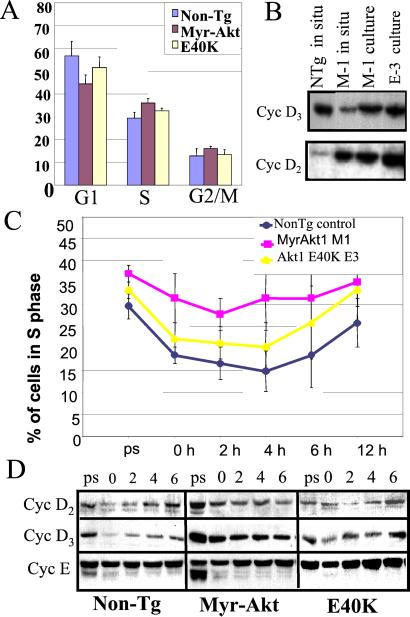
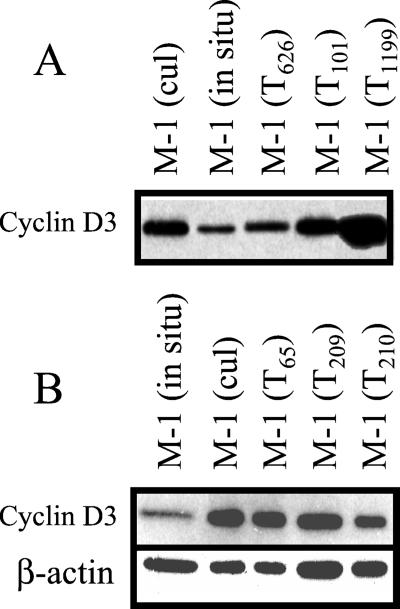
Transgenic mice expressing MyrAkt from a proximal Lck promoter construct develop thymomas at an early age, whereas transgenic mice expressing constitutively active Lck-AktE40K develop primarily tumors of the peripheral lymphoid organs later in life. The thymus of 6- to 8-week-old MyrAkt transgenic mice is normal in size but contains fewer, larger cells than the thymus of nontransgenic control and AktE40K transgenic mice. Earlier studies had shown that cell size and cell cycle are coordinately regulated. On the basis of this finding, and our observations that the oncogenic potential of Akt correlates with its effect on cell size, we hypothesized that mechanisms aimed at maintaining the size of the thymus dissociate cell size and cell cycle regulation by blocking MyrAkt-promoted G(1) progression and that failure of these mechanisms may promote cell proliferation resulting in an enlarged neoplastic thymus. To address this hypothesis, we examined the cell cycle distribution of freshly isolated and cultured thymocytes from transgenic and nontransgenic control mice. The results showed that although neither transgene alters cell cycle distribution in situ, the MyrAkt transgene promotes G(1) progression in culture. Freshly isolated MyrAkt thymocytes express high levels of cyclins D2 and E and cdk4 but lower than normal levels of cyclin D3 and cdk2. Cultured thymocytes from MyrAkt transgenic mice, on the other hand, express high levels of cyclin D3, suggesting that the hypothesized organ size control mechanisms may down-regulate the expression of this molecule. Primary tumor cells, similar to MyrAkt thymocytes in culture, express high levels of cyclin D3. These findings support the hypothesis that tumor induction is caused by the failure of organ size control mechanisms to down-regulate cyclin D3 and to block MyrAkt-promoted G(1) progression.
Figures
Similar articles
-
Induction of interleukin 2-responsiveness in thymocytes of the transgenic mice carrying lck-transgene.Microbiol Immunol. 1993;37(5):369-81. doi: 10.1111/j.1348-0421.1993.tb03224.x. Microbiol Immunol. 1993. PMID: 8102775
-
p27 deficiency cooperates with Bcl-2 but not Bax to promote T-cell lymphoma.PLoS One. 2008 Apr 2;3(4):e1911. doi: 10.1371/journal.pone.0001911. PLoS One. 2008. PMID: 18382684 Free PMC article.
-
Differential patterns of cell cycle regulatory proteins expression in transgenic models of thyroid tumours.Oncogene. 1998 Aug 6;17(5):631-41. doi: 10.1038/sj.onc.1201966. Oncogene. 1998. PMID: 9704929
-
Cyclin D2 overexpression in transgenic mice induces thymic and epidermal hyperplasia whereas cyclin D3 expression results only in epidermal hyperplasia.Am J Pathol. 2000 Sep;157(3):1039-50. doi: 10.1016/S0002-9440(10)64616-0. Am J Pathol. 2000. PMID: 10980142 Free PMC article.
-
Alternative mammary oncogenic pathways are induced by D-type cyclins; MMTV-cyclin D3 transgenic mice develop squamous cell carcinoma.Oncogene. 2003 Jul 10;22(28):4425-33. doi: 10.1038/sj.onc.1206488. Oncogene. 2003. PMID: 12853979
Cited by
-
Novel inhibitors of AKT: assessment of a different approach targeting the pleckstrin homology domain.Curr Med Chem. 2011;18(18):2727-42. doi: 10.2174/092986711796011292. Curr Med Chem. 2011. PMID: 21649580 Free PMC article. Review.
-
Hypomorphic mTOR Downregulates CDK6 and Delays Thymic Pre-T LBL Tumorigenesis.Mol Cancer Ther. 2020 Oct;19(10):2221-2232. doi: 10.1158/1535-7163.MCT-19-0671. Epub 2020 Aug 3. Mol Cancer Ther. 2020. PMID: 32747423 Free PMC article.
-
PI3K/AKT signaling and systemic autoimmunity.Immunol Res. 2005;31(1):47-55. doi: 10.1385/IR:31:1:47. Immunol Res. 2005. PMID: 15591622 Review.
-
A requirement for cyclin-dependent kinase 6 in thymocyte development and tumorigenesis.Cancer Res. 2009 Feb 1;69(3):810-8. doi: 10.1158/0008-5472.CAN-08-2473. Epub 2009 Jan 20. Cancer Res. 2009. PMID: 19155308 Free PMC article.
-
Akt maintains cell size and survival by increasing mTOR-dependent nutrient uptake.Mol Biol Cell. 2002 Jul;13(7):2276-88. doi: 10.1091/mbc.01-12-0584. Mol Biol Cell. 2002. PMID: 12134068 Free PMC article.
References
Publication types
MeSH terms
Substances
Grants and funding
LinkOut - more resources
Full Text Sources
Medical
Molecular Biology Databases
Miscellaneous
