

Identification of a small molecule inhibitor of Sir2p
- PMID: 11752457
- PMCID: PMC64992
- DOI: 10.1073/pnas.261574398
Identification of a small molecule inhibitor of Sir2p
Abstract
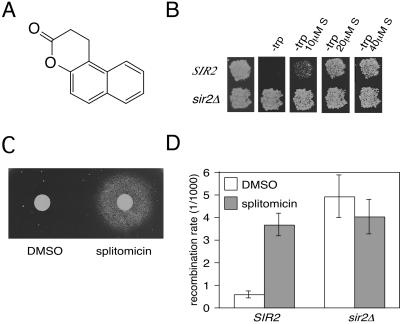
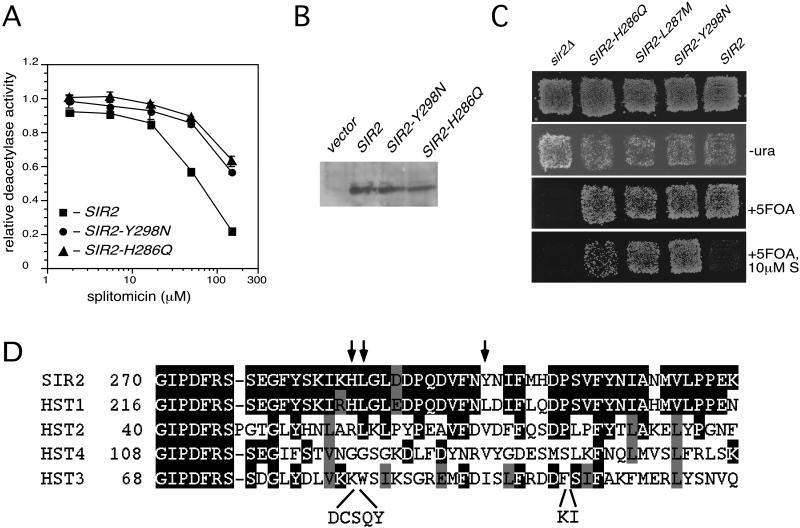
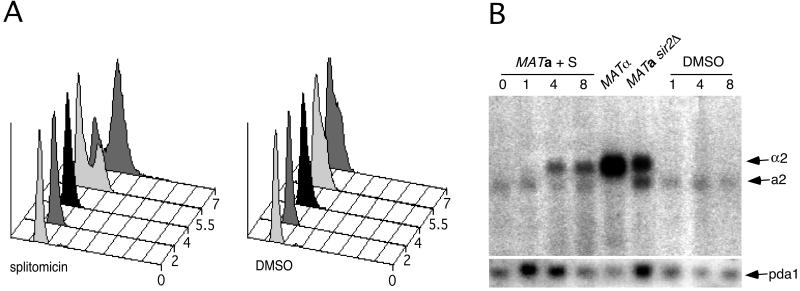
Sir2p is an NAD(+)-dependent histone deacetylase required for chromatin-dependent silencing in yeast. In a cell-based screen for inhibitors of Sir2p, we identified a compound, splitomicin, that creates a conditional phenocopy of a sir2 deletion mutant in Saccharomyces cerevisiae. Cells grown in the presence of the drug have silencing defects at telomeres, silent mating-type loci, and the ribosomal DNA. In addition, whole genome microarray experiments show that splitomicin selectively inhibits Sir2p. In vitro, splitomicin inhibits NAD(+)-dependent histone deacetylase activity (HDA) of the Sir2 protein. Mutations in SIR2 that confer resistance to the drug map to the likely acetylated histone tail binding domain of the protein. By using splitomicin as a chemical genetic probe, we demonstrate that continuous HDA of Sir2p is required for maintaining a silenced state in nondividing cells.
Figures

Similar articles
-
Identification of selective inhibitors of NAD+-dependent deacetylases using phenotypic screens in yeast.J Biol Chem. 2003 Dec 26;278(52):52773-82. doi: 10.1074/jbc.M308966200. Epub 2003 Oct 8. J Biol Chem. 2003. PMID: 14534292
-
Transcriptional silencing and longevity protein Sir2 is an NAD-dependent histone deacetylase.Nature. 2000 Feb 17;403(6771):795-800. doi: 10.1038/35001622. Nature. 2000. PMID: 10693811
-
Mutations in Saccharomyces cerevisiae gene SIR2 can have differential effects on in vivo silencing phenotypes and in vitro histone deacetylation activity.Mol Biol Cell. 2002 Apr;13(4):1427-38. doi: 10.1091/mbc.01-10-0482. Mol Biol Cell. 2002. PMID: 11950950 Free PMC article.
-
Deacetylase enzymes: biological functions and the use of small-molecule inhibitors.Chem Biol. 2002 Jan;9(1):3-16. doi: 10.1016/s1074-5521(02)00092-3. Chem Biol. 2002. PMID: 11841934 Review. No abstract available.
-
Gene silencing: two faces of SIR2.Curr Biol. 2000 Oct 5;10(19):R708-11. doi: 10.1016/s0960-9822(00)00714-4. Curr Biol. 2000. PMID: 11050406 Review.
Cited by
-
Structural basis for nicotinamide cleavage and ADP-ribose transfer by NAD(+)-dependent Sir2 histone/protein deacetylases.Proc Natl Acad Sci U S A. 2004 Jun 8;101(23):8563-8. doi: 10.1073/pnas.0401057101. Epub 2004 May 18. Proc Natl Acad Sci U S A. 2004. PMID: 15150415 Free PMC article.
-
The functional importance of telomere clustering: global changes in gene expression result from SIR factor dispersion.Genome Res. 2009 Apr;19(4):611-25. doi: 10.1101/gr.083881.108. Epub 2009 Jan 29. Genome Res. 2009. PMID: 19179643 Free PMC article.
-
Dual Tumor Suppressor and Tumor Promoter Action of Sirtuins in Determining Malignant Phenotype.Front Pharmacol. 2019 Jan 30;10:38. doi: 10.3389/fphar.2019.00038. eCollection 2019. Front Pharmacol. 2019. PMID: 30761005 Free PMC article. Review.
-
An automated high-resolution in vivo screen in zebrafish to identify chemical regulators of myelination.Elife. 2018 Jul 6;7:e35136. doi: 10.7554/eLife.35136. Elife. 2018. PMID: 29979149 Free PMC article.
-
SIRT1 inhibition alleviates gene silencing in Fragile X mental retardation syndrome.PLoS Genet. 2008 Mar 7;4(3):e1000017. doi: 10.1371/journal.pgen.1000017. PLoS Genet. 2008. PMID: 18369442 Free PMC article.
References
-
- Loo S, Rine J. Annu Rev Cell Dev Biol. 1995;11:519–548. - PubMed
-
- Lyon M F. Curr Biol. 1999;9:R235–R237. - PubMed
-
- Gartenberg M R. Curr Opin Microbiol. 2000;3:132–137. - PubMed
-
- Wu J, Grunstein M. Trends Biochem Sci. 2000;25:619–623. - PubMed
-
- Braunstein M, Rose A B, Holmes S G, Allis C D, Broach J R. Genes Dev. 1993;7:592–604. - PubMed
Publication types
MeSH terms
Substances
Grants and funding
LinkOut - more resources
Full Text Sources
Other Literature Sources
Molecular Biology Databases
