

doi: 10.1073/pnas.261228098.
Explaining mortality rate plateaus
Affiliations
- PMID: 11752476
- PMCID: PMC65038
- DOI: 10.1073/pnas.261228098
Item in Clipboard
Explaining mortality rate plateaus
Proc Natl Acad Sci U S A.
.
Abstract
We propose a stochastic model of aging to explain deviations from exponential growth in mortality rates commonly observed in empirical studies. Mortality rate plateaus are explained as a generic consequence of considering death in terms of first passage times for processes undergoing a random walk with drift. Simulations of populations with age-dependent distributions of viabilities agree with a wide array of experimental results. The influence of cohort size is well accounted for by the stochastic nature of the model.
Figures
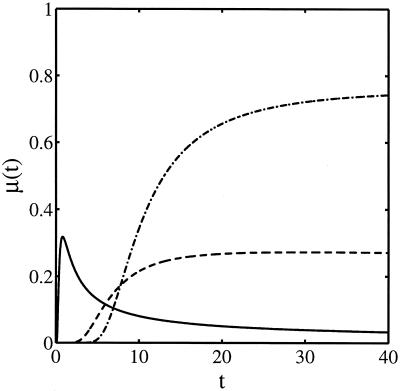
Mortality rates according to Eq. 9 with τ = 10 and
τr = 2, 50, and 150 corresponding to the solid,
dashed, and dot-dashed curves, respectively.
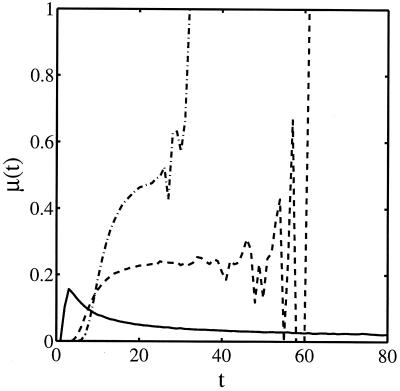
Mortality rates obtained via numerical simulations of a homogeneous
population of N = 106 organisms, the
dynamics of which is that of Eq. 1, with
v0 = 1, τ = 10, and
τr = 2, 50, and 150 corresponding to the solid,
dashed, and dot-dashed curves, respectively. Note that ɛ = 1/τ
and σ = τ .
.
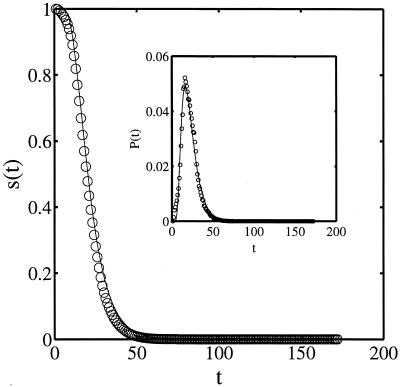
Survival probability at time t for experimental cohorts and
theoretical predictions based on Eq. 6 where ɛ̂ =
0.0448 and σ̂ = 0.0975. (Inset) A comparison of
the probability of dying at time t between experiment and
theory. In both cases open circles signify data points from Carey
et al. (5), and solid lines are predictions from theory.
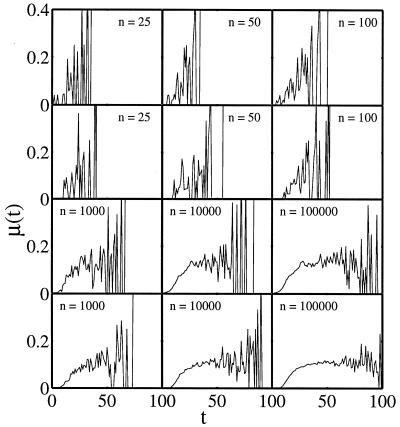
Age-specific mortality rates for cohorts of sizes ranging from
n = 25 to 100,000. Going from top to bottom, rows 1 and
3 are randomly sampled from experimental data. Rows 2 and 4 are from
simulations of Eq. 1 using MLE estimates as explained in
Application to Mortality Rate Data.
References
-
- Finch C. Longevity, Senescence, and the Genome. Chicago: Univ. of Chicago Press; 1990.
-
- Wachter K, Finch C, editors. Between Zeus and the Salmon: The Biodemography of Longevity. Washington, DC: Natl. Acad. Press; 1997. - PubMed
-
- Johnson F, Sinclair D, Guarente L. Cell. 1999;96:291–302. - PubMed
-
- Gompertz B. Philos Trans R Soc London A. 1825;115:513–525.
-
- Carey J, Liedo P, Orozco D, Vaupel J. Science. 1992;258:457–461. - PubMed
Publication types
MeSH terms
LinkOut - more resources
Full Text Sources
