. 2002 Jan;30(1):110-6.
doi: 10.1038/ng811. Epub 2001 Dec 20.

Positional cloning of the combined hyperlipidemia gene Hyplip1

Affiliations

Positional cloning of the combined hyperlipidemia gene Hyplip1

Jackie S Bodnar et al. Nat Genet. 2002 Jan.

Abstract

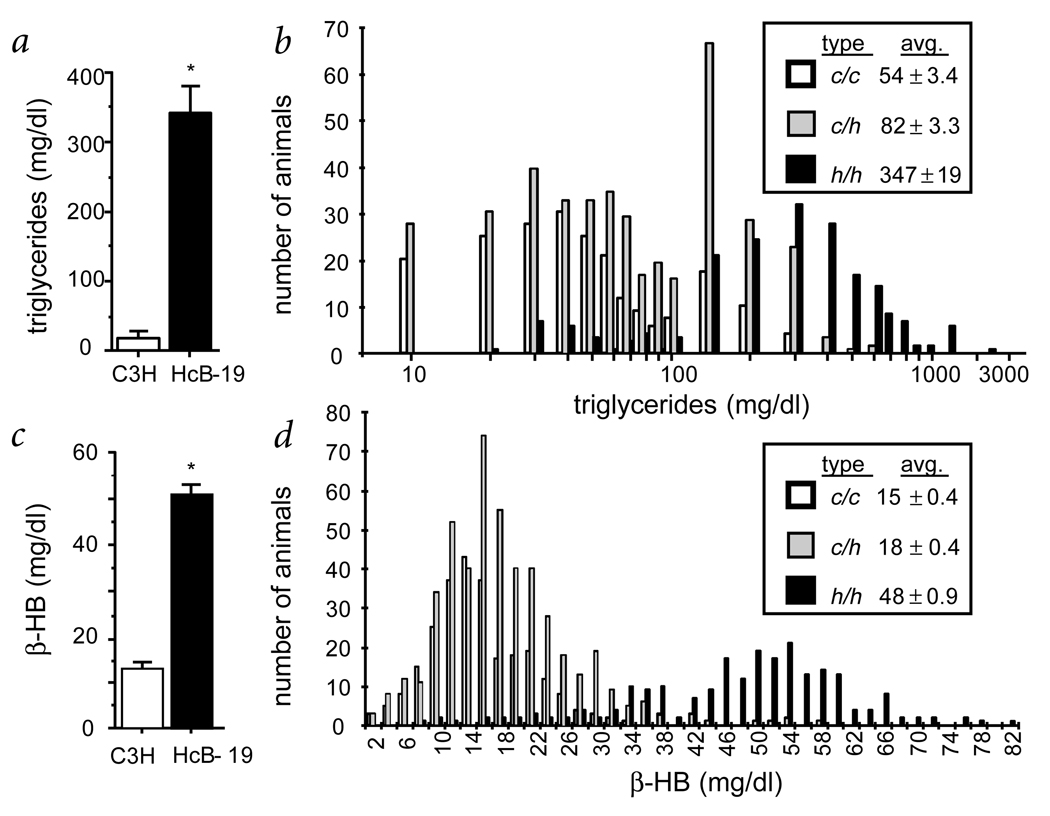
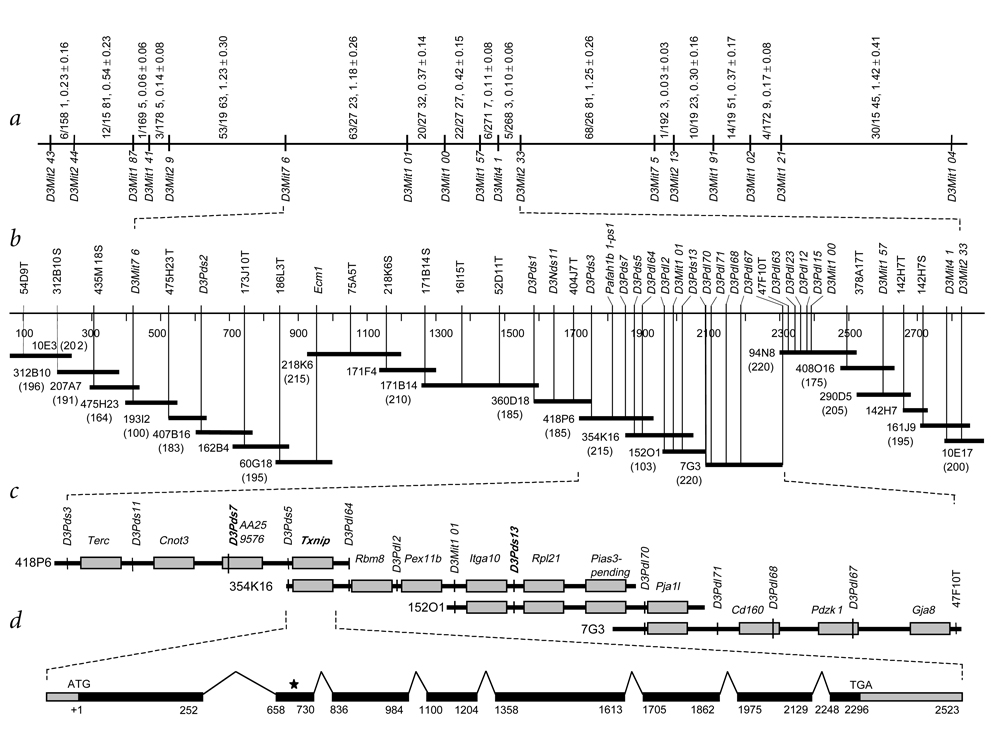
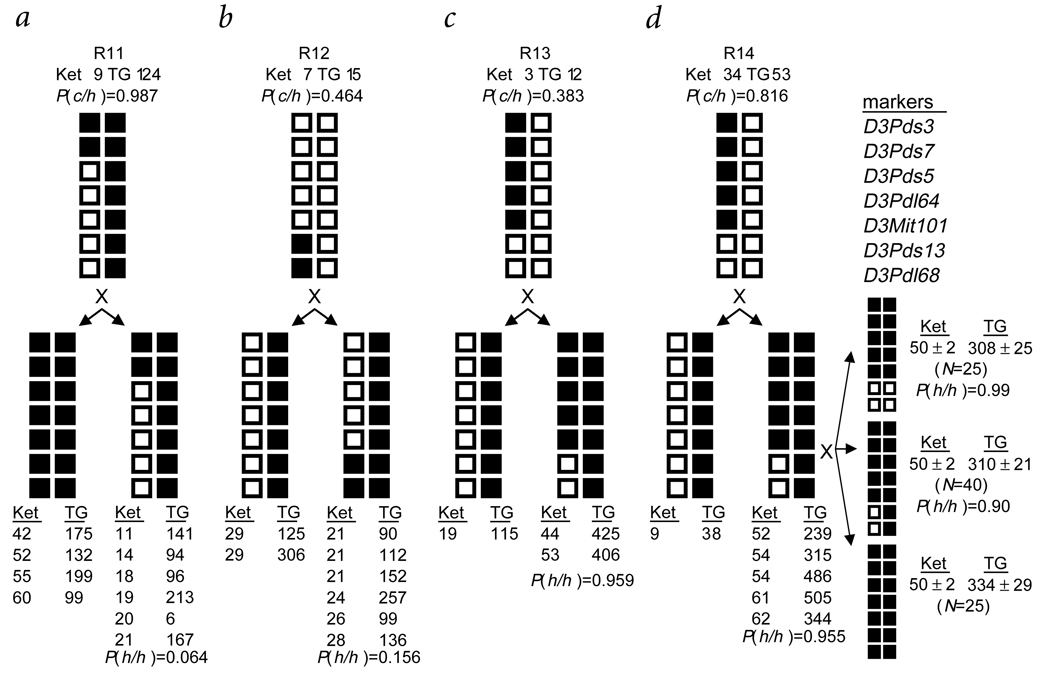
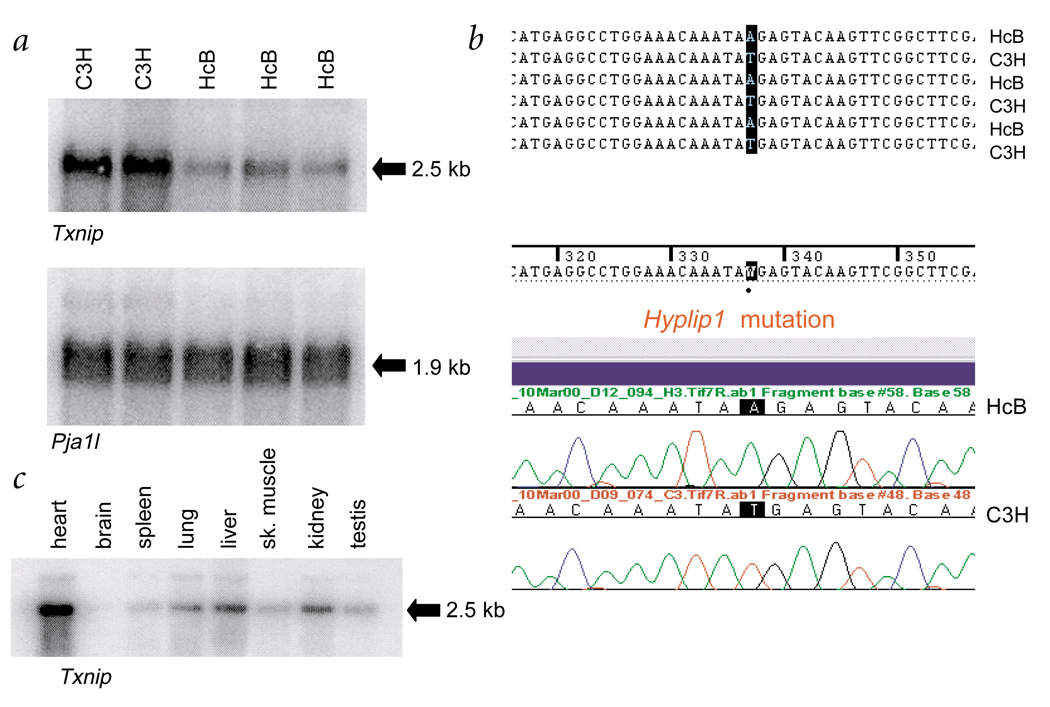
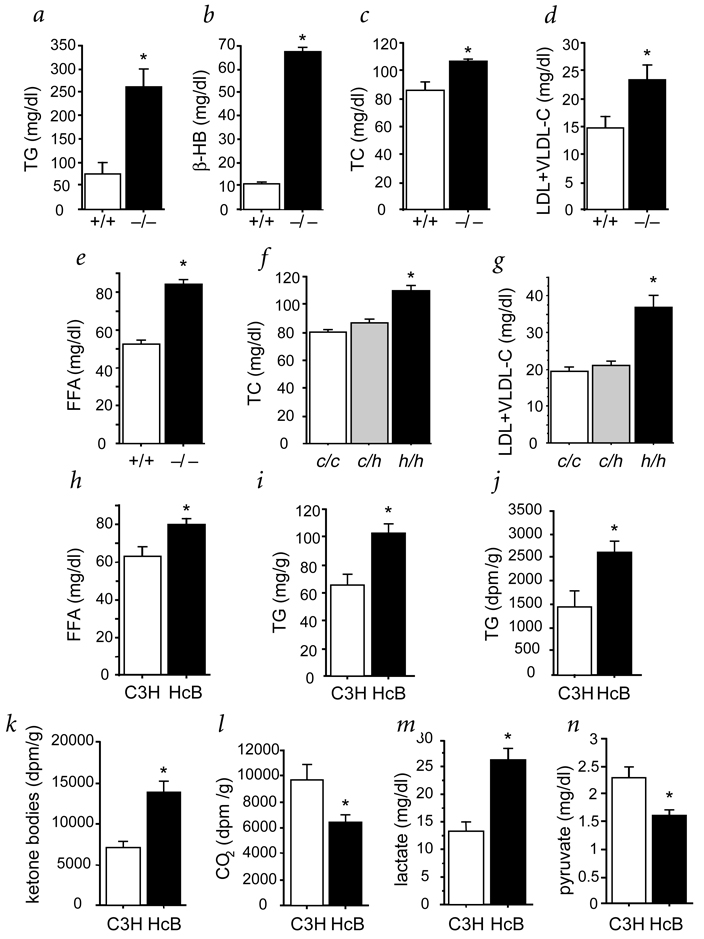
Familial combined hyperlipidemia (FCHL, MIM-144250) is a common, multifactorial and heterogeneous dyslipidemia predisposing to premature coronary artery disease and characterized by elevated plasma triglycerides, cholesterol, or both. We identified a mutant mouse strain, HcB-19/Dem (HcB-19), that shares features with FCHL, including hypertriglyceridemia, hypercholesterolemia, elevated plasma apolipoprotein B and increased secretion of triglyceride-rich lipoproteins. The hyperlipidemia results from spontaneous mutation at a locus, Hyplip1, on distal mouse chromosome 3 in a region syntenic with a 1q21-q23 FCHL locus identified in Finnish, German, Chinese and US families. We fine-mapped Hyplip1 to roughly 160 kb, constructed a BAC contig and sequenced overlapping BACs to identify 13 candidate genes. We found substantially decreased mRNA expression for thioredoxin interacting protein (Txnip). Sequencing of the critical region revealed a Txnip nonsense mutation in HcB-19 that is absent in its normolipidemic parental strains. Txnip encodes a cytoplasmic protein that binds and inhibits thioredoxin, a major regulator of cellular redox state. The mutant mice have decreased CO2 production but increased ketone body synthesis, suggesting that altered redox status down-regulates the citric-acid cycle, sparing fatty acids for triglyceride and ketone body production. These results reveal a new pathway of potential clinical significance that contributes to plasma lipid metabolism.


Figures

Fig. 1
Fig. 1
Distributions of triglyceride and ketone body levels. a, Plasma levels of triglycerides in HcB-19 and its C3H parental control. The average ± s.e.m. is shown for six animals in each group. Asterisk indicates P<0.0001. b, Distribution of plasma triglycerides in (HcB-19 × CAST/Ei)F2 mice grouped by genotype at D3Mit101 so that each group represents animals with triglycerides within a certain interval (for example, the group at 30 represents animals with triglycerides from 21–30 mg dl−1). Filled bars indicate values for animals homozygous with respect to HcB-19 alleles (h/h), hatched bars indicate heterozygote values (c/h) and open bars denote values for animals homozygous with respect to wildtype CAST/Ei alleles (c/c). The genotype and average triglyceride value ± s.e.m. (avg.) in mg dl−1 for each group are indicated in the legend box. N=259 wildtype, 489 heterozygote and 214 homozygote animals. c, Plasma levels of ketone body β-hydroxybutyrate in the HcB-19 mouse and its C3H parent control. The average ± s.e.m. is shown for six animals in each group. Asterisk indicates P<0.0001. d, Distribution of plasma levels of ketone body β-hydroxybutyrate in (HcB-19 × CAST/Ei)F2 mice grouped by genotype at D3Mit101 so that each group represents animals with plasma ketone body levels within a certain interval (for example, the group at 30 represents animals with ketone bodies from 29–30 mg dl−1). N=259 wildtype, 489 heterozygote and 214 homozygote animals. Abbreviations and designations are identical to panel b.
Fig. 2
Fig. 2
Physical- and fine-mapping of the Hyplip1 locus. a, Fine-mapping of (HcB-19 × CAST/Ei)F2 animals by genotyping 17 microsatellite markers. The ratios of the number of recombinants to the total number of informative mice plus the recombination frequencies ± s.e.m. (in cM) are shown. b, The minimum tiling path of the BAC contig for the Hyplip1 locus. Solid black lines represent 22 individual BAC clones. The BAC clone name is listed, and the BAC size in kb (when known) is given in parenthesis. Markers, genes, and BAC end clone sequences are shown at the top, and the estimated physical distances (in kb) are given. The limiting breakpoint markers that define the maximal location of the gene Hyplip1 are in boldface. c, Four overlapping BACs from the Hyplip1 locus that were subcloned and sequenced to identify 13 candidate genes. Each BAC clone name is given; gray boxes depict genes. The approximate positions of microsatellite markers and SNPs are shown. The Hyplip1 gene (Txnip) and the markers that define the maximal location of Hyplip1 are shown in boldface. d, Genomic structure of Hyplip1 (Txnip). Solid black lines indicate the eight exons of Txnip, and an asterisk indicates the location of the T→A nonsense mutation observed in strain HcB-19. Numbers listed below the figure indicate the DNA base positions of the exon-intron junctions.
Fig. 3
Fig. 3
Recombinant animals and their HcB-19 backcross progeny that define the maximal critical interval containing Hyplip1. a, Recombinant R11 and 10 backcross progeny. Backcross mice are grouped according to the inheritance of a recombinant or nonrecombinant haplotype across the Hyplip1 locus for the seven markers listed at the right. Filled boxes indicate HcB-19 (h) alleles and open boxes denote CAST/Ei (c) alleles. Ketone body (Ket) and triglyceride (TG) levels in mg dl−1 are given for each parental recombinant and their progeny. The predictive probability of heterozygosity, P(c/h), is shown for each parental recombinant, and the average predictive probability of homozygosity, P(h/h), is given for backcross progeny with the same haplotype. The R11 recombinant and all six backcross progeny with the same haplotype have lower β-HB and TG levels as compared with littermates homozygous with respect to HcB-19 alleles. R11 had a high probability of being heterozygous [P(c/h)=0.987] and the backcross progeny had a low probability of homozygosity with respect to Hyplip1 [P(h/h)=0.064], indicating that Hyplip1 is distal to D3Pds7. b, Recombinant R12 and 8 backcross progeny. All six backcross progeny with the parental haplotype have normal β-HB and TG levels, with a low probability of homozygosity with respect to Hyplip1 [P(h/h)=0.156]. Thus, Hyplip1 lies proximal to D3Pds13. c, Recombinant R13 and 3 backcross progeny. As shown, R13 carries Hyplip1 alleles proximal to D3Pds13. Backcross progeny carrying this crossover have increased amounts of β-HB and TG, indicating homozygosity for Hyplip1 with a high probability [P(h/h)=0.959], giving further evidence that Hyplip1 is proximal to D3Pds13. d, Recombinant R14, six backcross progeny, and 90 animals obtained from intercrossing backcross progeny with the crossover breakpoint. R14 had a high probability of being heterozygous [P(c/h)=0.816]. Backcross progeny with the same haplotype have increased amounts of β-HB and TG, indicating homozygosity with respect to Hyplip1 [P(h/h)=0.955]. When these mice are intercrossed, all resultant progeny have increased β-HB and TG levels (the average ± s.e.m. for each genotypic group is shown), providing additional evidence for placing the distal boundary for Hyplip1 at D3Pds13.
Fig. 4
Fig. 4
Expression and sequence analysis of Txnip. a, Northern blot data revealing decreased mRNA expression for Txnip in HcB-19 as compared with the C3H parental control strain. Expression levels for another gene from the Hyplip1 region, Pja1l, serve as a locus and RNA loading control. b, Sequence analysis of HcB-19 and C3H mice reveals a T→A transversion mutation present in HcB-19 that is absent from the C3H strain from which it was derived. The sequence chromatograms from HcB-19 and C3H mice are shown, as well as the DNA sequence data from three HcB-19 and three C3H mice. c, Northern-blot analysis of the Txnip transcript in various tissues reveals detectable expression in brain, spleen, lung, liver, skeletal muscle, kidney and testis, with the highest abundance occurring in heart.
Fig. 5
Fig. 5
Metabolic consequences of the Hyplip1 nonsense mutation in Txnip. a, Plasma triglycerides for (HcB-19 × C57BL/6J)N4 congenic mice homozygous (−/−) or wildtype (+/+) for the Hyplip1 nonsense mutation. N=6 animals in each group. Asterisk indicates P<0.005. b, Plasma β-hydroxybutyrate levels for (HcB-19 × C57BL/6J)N4 congenic mice. N=6 animals in each group. Asterisk indicates P<0.0001. ce, Plasma levels for total cholesterol (c), LDL+VLDL cholesterol (d) and free fatty acids (e) for (HcB-19 × C57BL/6J)N4 congenic mice. N=6 animals in each group. Asterisk indicates P<0.05. f,g, Plasma levels for total cholesterol (f) and LDL+VLDL cholesterol (g) for (HcB-19 × CAST/Ei)F2 animals grouped by genotype at marker D3Mit101. N=124 wildtype (c/c), 273 heterozygote (c/h) and 113 animals homozygous (h/h) with respect to Hyplip1 mutant alleles. Asterisk indicates P<0.00005. h, Plasma free fatty acid levels for nine HcB-19 (HcB) and nine C3H controls. Asterisk indicates P<0.01. i, Total hepatic triglyceride content (in mg per g of liver tissue) from HcB-19 and C3H livers that were perfused to remove plasma lipids. N=4 C3H animals and 5 HcB-19 animals. Asterisk indicates P<0.01. j, Dpm of 14C-oleic acid per g of liver tissue in newly-synthesized triglycerides secreted from liver slices isolated from fasted HcB-19 and C3H mice. N=6 animals in each group. Asterisk indicates P<0.05. k, Amount of newly-synthesized ketone bodies (in dpm per g of liver tissue) from isolated liver slices. N=5 C3H and 6 HcB-19 animals. Asterisk indicates P<0.005. l, Amount of newly-synthesized CO2 (in dpm per g of liver tissue) from isolated liver slices. N=4 C3H and 5 HcB-19 animals. Asterisk indicates P<0.05. m, Plasma lactate levels (in mg dl−1) from HcB-19 and C3H mice. Asterisk indicates P<0.001. N=5 animals in each group. n, Pyruvate levels (in mg dl−1) from whole blood from HcB-19 and C3H mice. Asterisk indicates P<0.008. N=5 animals in each group.

Similar articles

Cited by

References

    1. Genest JJ, Jr, et al. Familial lipoprotein disorders in patients with premature coronary artery disease. Circulation. 1992;85:2025–2033. - PubMed
    1. Grundy SM, Chait A, Brunzell JD. Familial combined hyperlipidemia workshop. Arteriosclerosis. 1987;7:203–207.
    1. Goldstein JL, Schrott HG, Hazzard WR, Bierman EL, Motulsky AG. Hyperlipidemia in coronary heart disease. II. Genetic analysis of lipid levels in 176 families and delineation of a new inherited disorder, combined hyperlipidemia. J. Clin. Invest. 1973;52:1544–1568. - PMC - PubMed
    1. Nikkila EA, Aro A. Family study of serum lipids and lipoproteins in coronary heart-disease. Lancet. 1973;1:954–959. - PubMed
    1. Castellani LW, et al. Mapping a gene for combined hyperlipidaemia in a mutant mouse strain. Nature Genet. 1998;18:374–377. - PubMed

Publication types

MeSH terms

Associated data

LinkOut - more resources