

doi: 10.1086/338760.
Epub 2001 Dec 20.
Evidence for linkage of stature to chromosome 3p26 in a large U.K. Family data set ascertained for type 2 diabetes
Affiliations
- PMID: 11753821
- PMCID: PMC384928
- DOI: 10.1086/338760
Item in Clipboard
Evidence for linkage of stature to chromosome 3p26 in a large U.K. Family data set ascertained for type 2 diabetes
Am J Hum Genet.
2002 Feb.
Abstract
We have analyzed data from 573 pedigrees from the United Kingdom for evidence for linkage to loci influencing adult stature. Our data set comprised 1,214 diabetic and 163 nondiabetic siblings for whom height data were available. We used variance-components analysis implemented in GENEHUNTER 2 and a modification of the Haseman-Elston regression method, HE-COM. We found evidence for a locus on 3p26 (LOD score 3.17) influencing height in this adult sample, with less-significant evidence for loci on chromosomes 7, 10, 15, 17, 19, and 20. Our findings extend similar recent studies in Scandinavian and Quebecois populations, adding further evidence that height is indeed under the control of multiple genes.
Figures
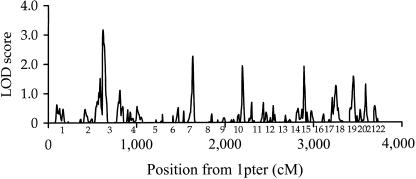
Multipoint genomewide variance-components linkage analysis of adult stature, with 418 autosomal microsatellite markers. The analysis was performed on a sample of 573 nuclear pedigrees containing 1,136 phenotyped sib pairs, with GENEHUNTER 2. Chromosome numbers on the X-axis are placed at the midpoint of the respective chromosomes.
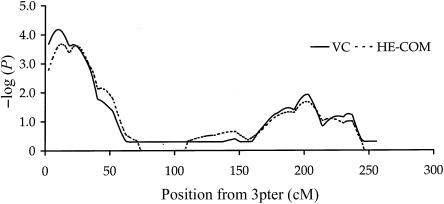
Multipoint variance-components and HE-COM linkage analyses of adult stature, with 23 microsatellite markers on chromosome 3. For comparison between the two analyses, variance-components LOD scores are presented as −log10(nominal P value). QMS2 assigns P=1 for zero or negative values of the test statistic.
References
Electronic Database Information
-
- Laboratory of Statistical Genetics (Rockefeller University) Web site, ftp://linkage.rockefeller.edu/software/simulate/ (for SIMULATE)
-
- Online Mendelian Inheritance in Man (OMIM), http://www.ncbi.nlm.nih.gov/Omim/ (for DEC1 [MIM 604256])
-
- Warren 2 Project Information (Wellcome Trust Centre for Human Genetics, Oxford), http://www.well.ox.ac.uk/warren2/ (for Warren 2 scan marker information)
References
-
- Dib C, Fauré S, Fizames C, Samson D, Druout N, Vignal A, Millasseau P, Marc S, Hazan J, Seboun E, Lathrop M, Gyapay G, Morissette J, Weissenbach J (1996) A comprehensive genetic map of the human genome based on 5,264 microsatellites. Nature 380:152–154 - PubMed
-
- Erens B, Primatesta P (2001) Health Survey for England 1998, The Stationary Office, London
Publication types
MeSH terms
LinkOut - more resources
Full Text Sources
Other Literature Sources
Medical
Molecular Biology Databases
