Comparative Study
. 2001 Oct-Dec;2(4):183-91.
doi: 10.3348/kjr.2001.2.4.183.

Diffusion-weighted MR imaging of intracerebral hemorrhage

Affiliations
Comparative Study

Diffusion-weighted MR imaging of intracerebral hemorrhage

B K Kang et al. Korean J Radiol. 2001 Oct-Dec.

Abstract

Objective: To document the signal characteristics of intracerebral hemorrhage (ICH) at evolving stages on diffusion-weighted images (DWI) by comparison with conventional MR images.

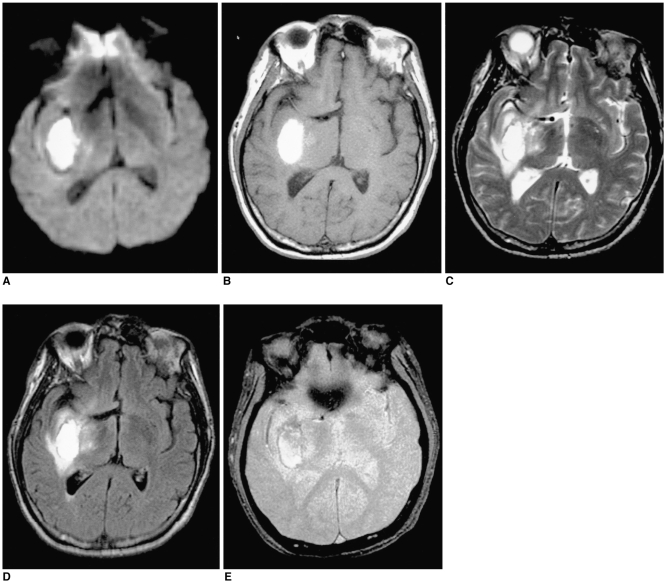
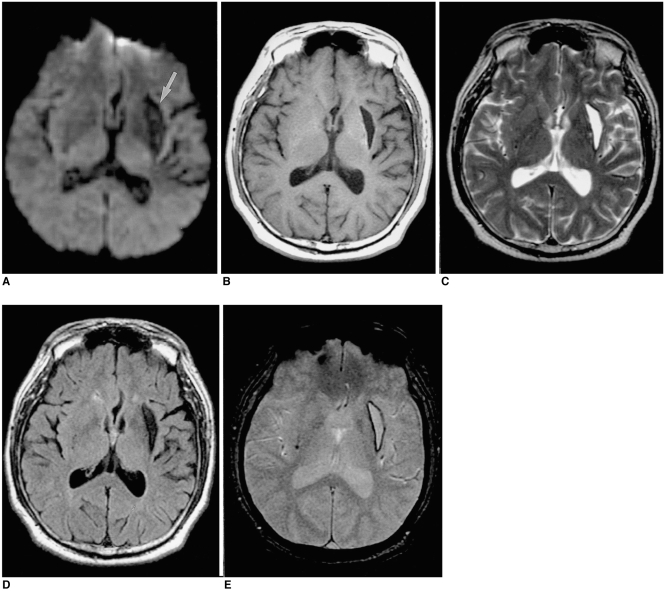
Materials and methods: In our retrospective study, 38 patients with ICH underwent a set of imaging sequences that included DWI, T1-and T2-weighted imaging, and fluid-attenuated inversion recovery (FLAIR). In 33 and 10 patients, respectively, conventional and echo-planar T2* gradient-echo images were also obtained. According to the time interval between symptom onset and initial MRI, five stages were categorized: hyperacute (n=6); acute (n=7); early subacute (n=7); late subacute (n=10); and chronic (n=8). We investigated the signal intensity and apparent diffusion coefficient (ADC) of ICH and compared the signal intensities of hematomas at DWI and on conventional MR images.

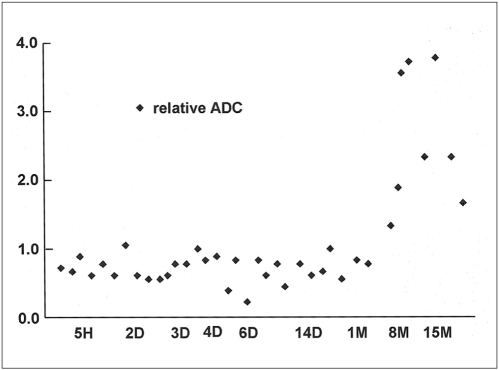
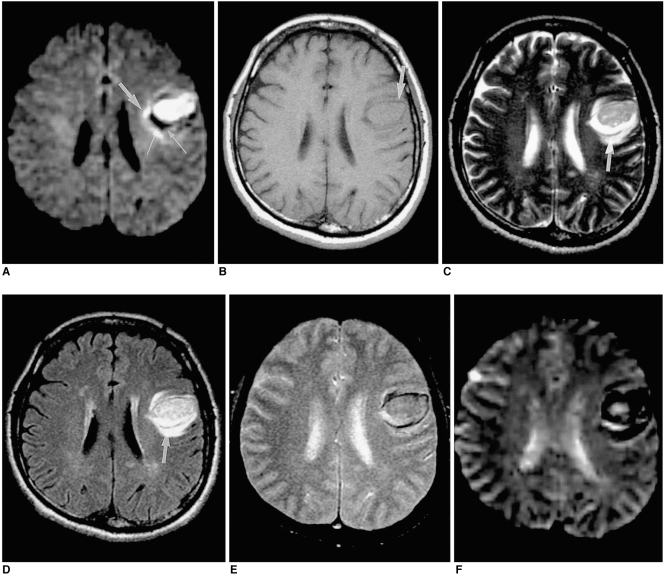
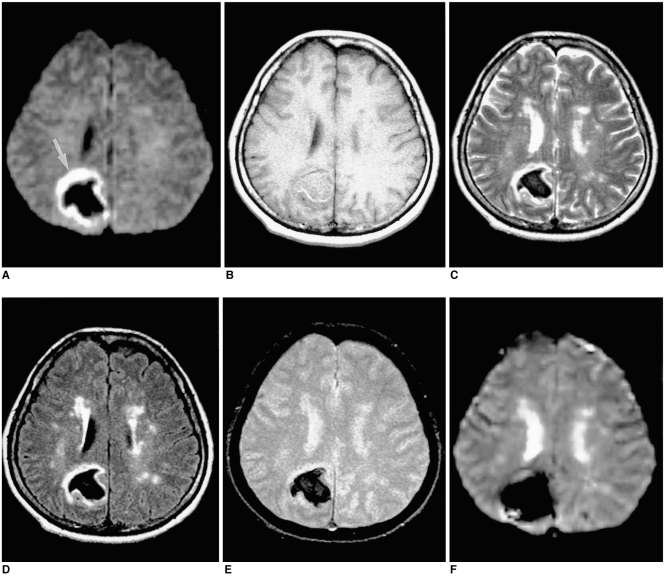
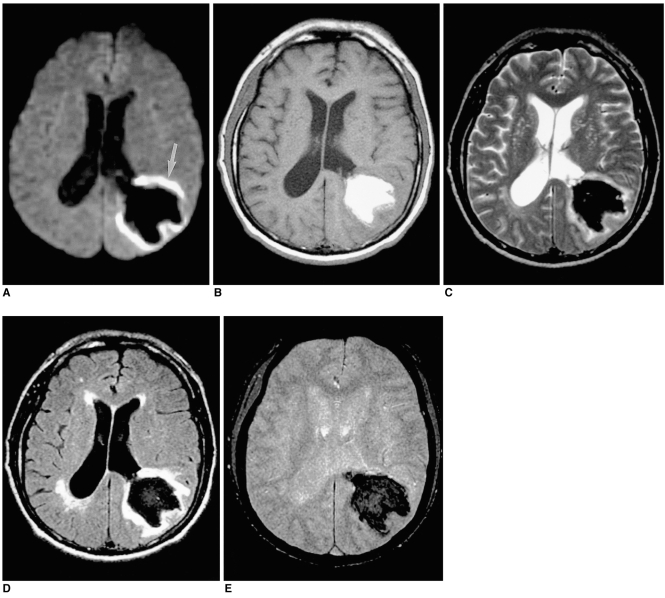
Results: DWI showed that hematomas were hyperintense at the hyperacute and late subacute stages, and hypointense at the acute, early subacute and chronic stages. Invariably, focal hypointensity was observed within a hyperacute hematoma. At the hyperacute, acute and early subacute stages, hyperintense rims that corresponded with edema surrounding the hematoma were present. The mean ADC ratio was 0.73 at the hyperacute stage, 0.72 at the acute stage, 0.70 at the early subacute stage, 0.72 at the late subacute stage, and 2.56 at the chronic stage.

Conclusion: DWI showed that the signal intensity of an ICH may be related to both its ADC value and the magnetic susceptibility effect. In patients with acute stroke, an understanding of the characteristic features of ICH seen at DWI can be helpful in both the characterization of intracranial hemorrhagic lesions and the differentiation of hemorrhage from ischemia.


Figures

Fig. 1
Fig. 1
The time course of relative ADC. The graph shows that in hyperacute, acute, early subacute, and late subacute hematomas, relative ADC is consistently lower than that of normal contralateral white matter. Only in chronic hematoma is relative ADC elevated.
Fig. 2
Fig. 2
A 53-year-old man with hyperacute intracerebral hematoma seen on MR images obtained 2 hours after the onset of symptoms. A. Diffusion-weighted image shows the hematoma as hyperintense, and a peripheral focal area of marked hypointensity is observed (thin arrows). In addition, a hyperintense rim (arrow) is demonstrated around the hematoma. B. T1-weighted image shows an isointense hematoma with a hypointense rim (arrow) in the left frontal lobe. C, D. On T2-weighted (C) and FLAIR (D) images, the hematoma is hyperintense, and a thin hypointense rim (arrows) is seen inside the region of perilesional edema. E, F. Conventional (E) and echo-planar (F) T2* gradient-echo images show greater signal loss around this isointense hematoma. The focal hypointense area seen on this diffusion-weighted image does not accurately correspond to the hypointense rim seen on T2-weighted and conventional T2* gradient-echo images. The hypointense area (thin arrow) apparent at DWI corresponds to the hyperintense area seen inside the hypointense rim on the T2-weighted image, which appears to be a liquid separated from a clot.
Fig. 3
Fig. 3
A 49-year-old woman with acute intracerebral hematoma seen on MR images obtained two days after the onset of symptoms. A. Diffusion-weighted image shows the hematoma as markedly hypointense, with a continuous rim of bright signal intensity (arrow) corresponding to the high signal area surrounding the hematoma seen on a T2-weighted image (C). B. T1-weighted image shows an isointense hematoma in the right parietal lobe. C-F. T2-weighted (C), FLAIR (D), conventional T2* gradient-echo (E), and echo-planar T2* gradient-echo (F) images depict a markedly hypointense hematoma.
Fig. 4
Fig. 4
A 56-year-old man with early subacute intracerebral hematoma seen on MR images obtained four days after the onset of symptoms. A. Diffusion-weighted image depicts the hematoma as markedly hypointense and surrounded by a continuous rim of bright signal intensity (arrow). B. T1-weighted image shows a hyperintense hematoma in the left parieto-occipital lobe. C-E. T2-weighted (C), FLAIR (D), and conventional T2* gradient-echo (E) images depict a hypointense hematoma.
Fig. 5
Fig. 5
A 51-year-old man with late subacute intracerebral hematoma seen on MR images obtained 14 days after the onset of symptoms. A. Diffusion-weighted image shows the hematoma as markedly hyperintense. B-E. T1-weighted (B), T2-weighted (C), FLAIR (D), and conventional T2* gradient-echo (E) images depict a hyperintense hematoma in the right basal ganglia.
Fig. 6
Fig. 6
A 62-year-old man with chronic intracerebral hematoma seen on MR images obtained one year after the onset of symptoms. A. Diffusion-weighted image indicates that the hematoma is isointense at its small central core and has a hypointense rim (arrow). B. T1-weighted image reveals a hypointense hematoma in the left basal ganglia. C. T2-weighted image depicts a hyperintense hematoma with a thin hypointense rim. D. FLAIR image of an isointense hematoma surrounded by a thin hypointense rim. E. Conventional T2* gradient-echo image shows a hyperintense hematoma with a hypointense rim that is more prominent than on the T2-weighted image (C).

References

    1. Gomori JM, Grossman RI, Goldberg HI, Zimmerman RA, Bilaniuk LT. Intracranial hematomas: imaging by high-field MR. Radiology. 1985;157:87–93. - PubMed
    1. Bradley WG. MR appearance of hemorrhage in the brain. Radiology. 1993;189:15–26. - PubMed
    1. Ebisu T, Tanaka C, Umeda M, et al. Hemorrhagic and nonhemorrhagic stroke: diagnosis with diffusion-weighted and T2-weighted echo-planar MR imaging. Radiology. 1997;203:823–828. - PubMed
    1. Schellinger PD, Jansen O, Fiebach JB, Hacke W, Sartor K. A standardized MRI stroke protocol: comparison with CT in hyperacute intracerebral hemorrhage. Stroke. 1999;30:765–768. - PubMed
    1. Felber S, Auer A, Wolf C, et al. MRI characteristics of spontaneous intracerebral hemorrhage. Radiologe. 1999;39:838–846. - PubMed

Publication types