. 2001 Dec 24;155(7):1225-38.
doi: 10.1083/jcb.200108073. Epub 2001 Dec 24.

Small cargo proteins and large aggregates can traverse the Golgi by a common mechanism without leaving the lumen of cisternae

Affiliations

Small cargo proteins and large aggregates can traverse the Golgi by a common mechanism without leaving the lumen of cisternae

A A Mironov et al. J Cell Biol. .

Abstract

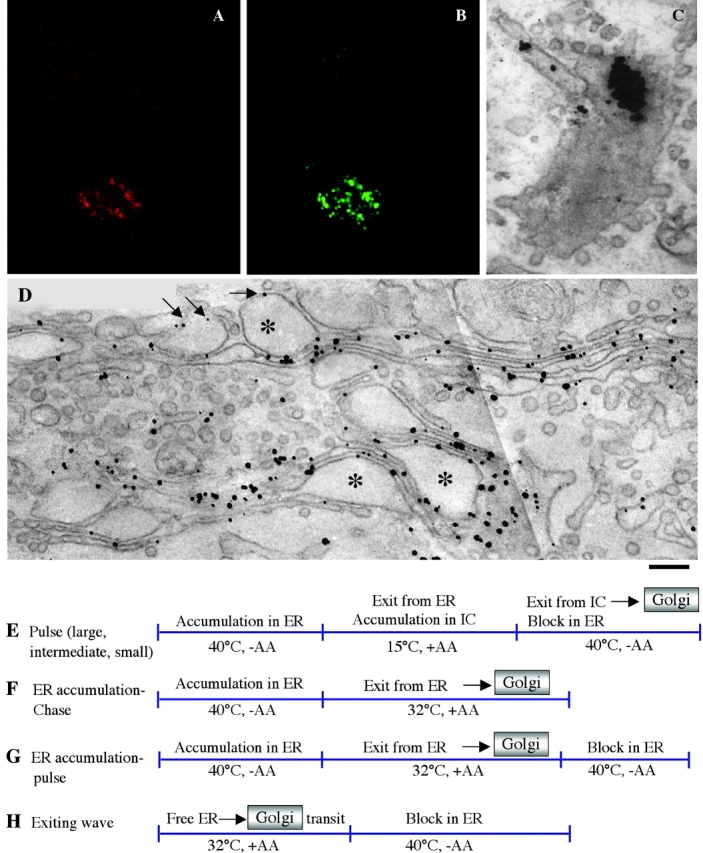
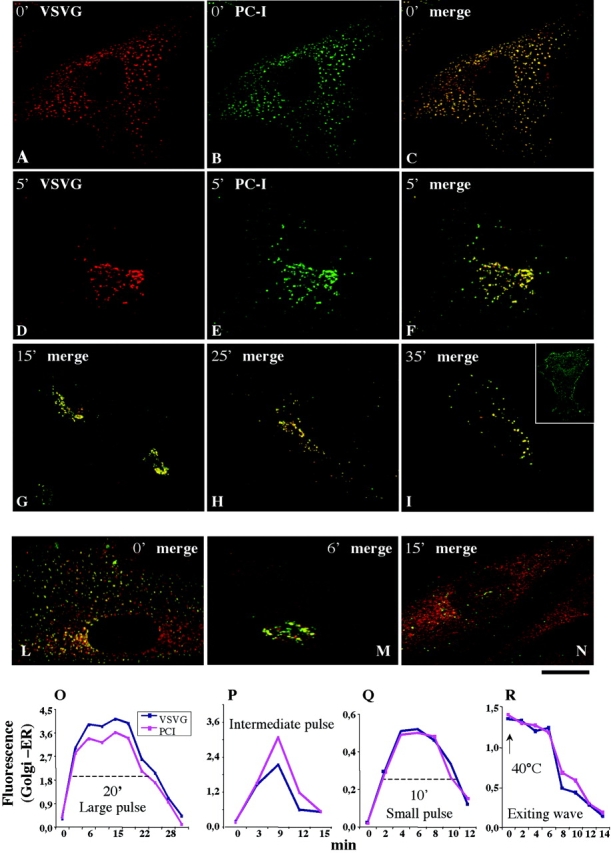
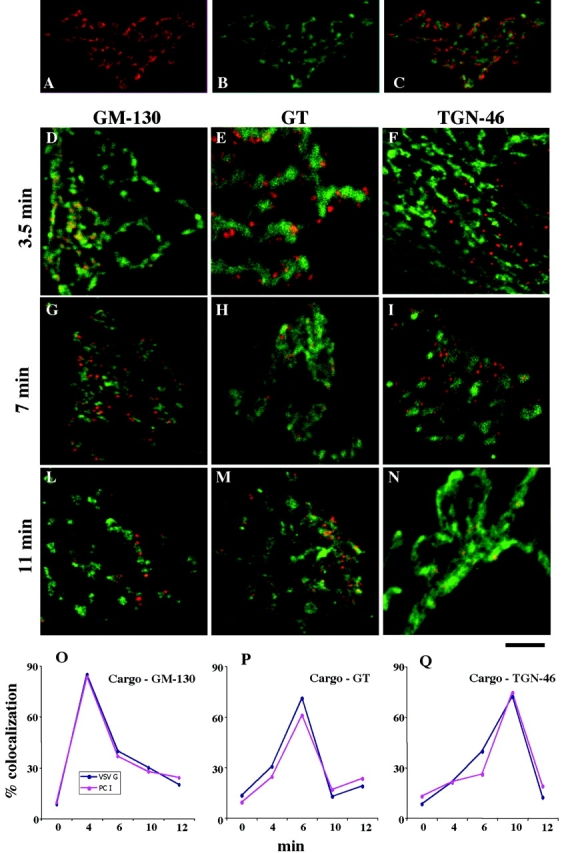
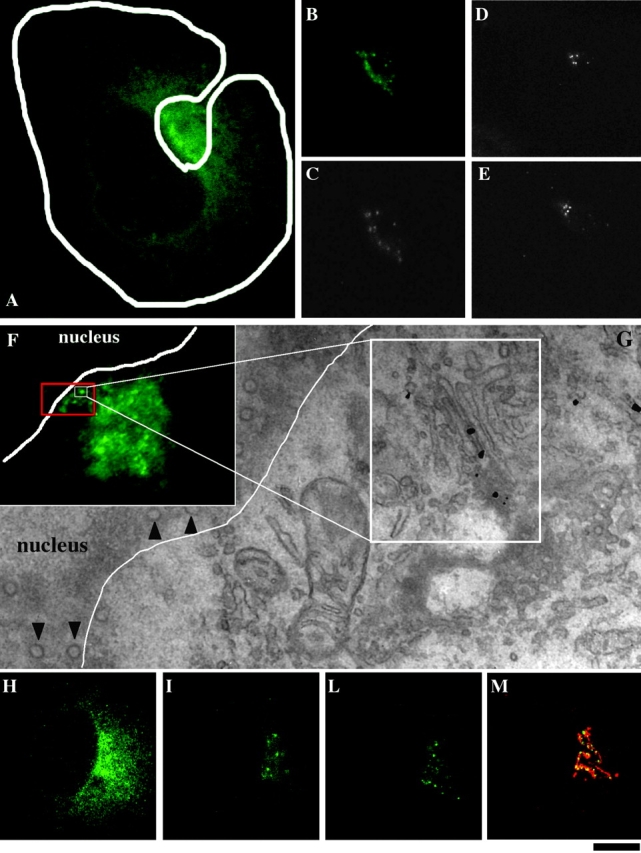
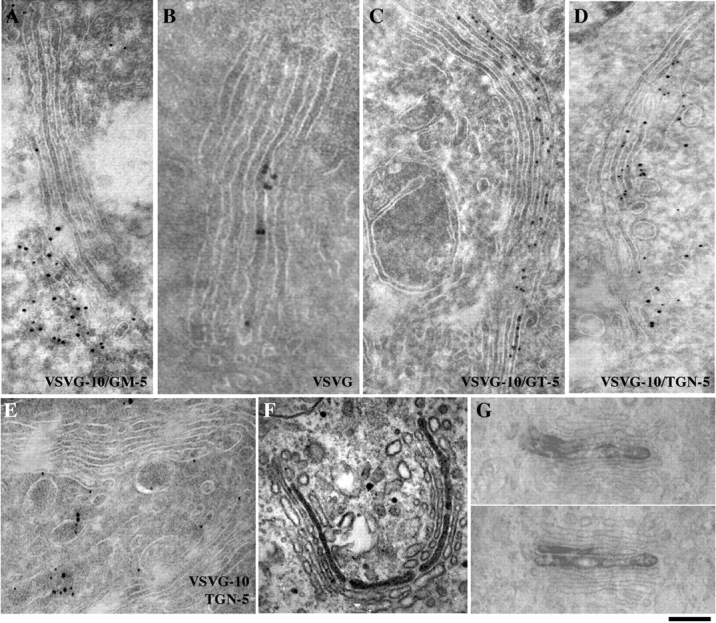
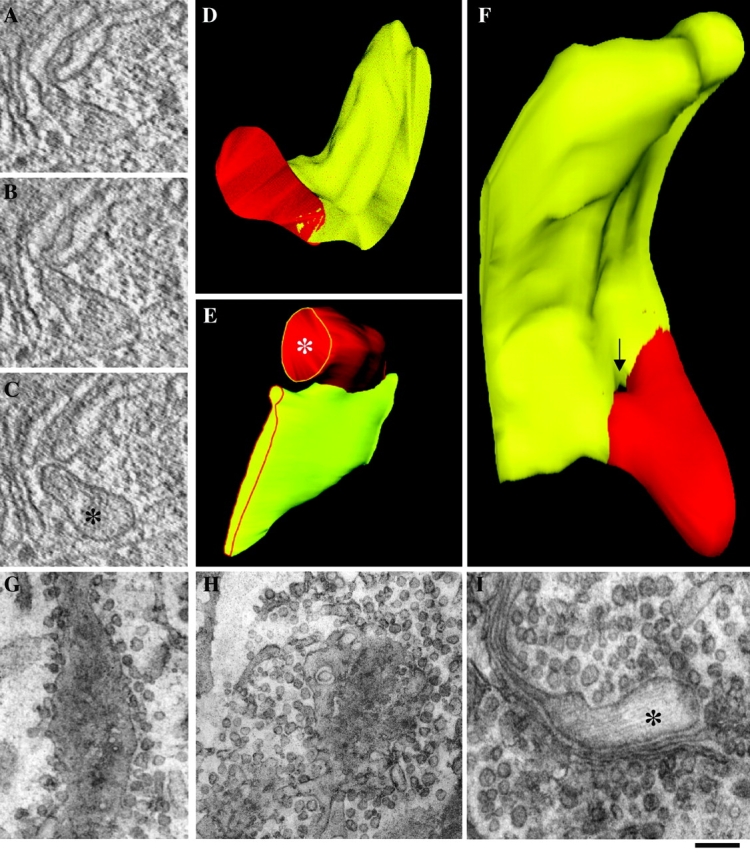
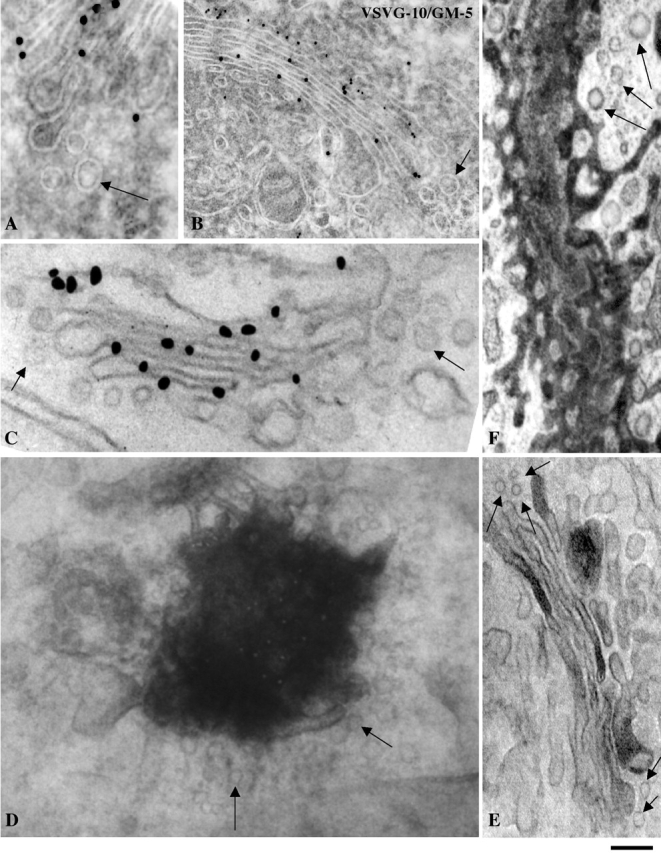
Procollagen (PC)-I aggregates transit through the Golgi complex without leaving the lumen of Golgi cisternae. Based on this evidence, we have proposed that PC-I is transported across the Golgi stacks by the cisternal maturation process. However, most secretory cargoes are small, freely diffusing proteins, thus raising the issue whether they move by a transport mechanism different than that used by PC-I. To address this question we have developed procedures to compare the transport of a small protein, the G protein of the vesicular stomatitis virus (VSVG), with that of the much larger PC-I aggregates in the same cell. Transport was followed using a combination of video and EM, providing high resolution in time and space. Our results reveal that PC-I aggregates and VSVG move synchronously through the Golgi at indistinguishable rapid rates. Additionally, not only PC-I aggregates (as confirmed by ultrarapid cryofixation), but also VSVG, can traverse the stack without leaving the cisternal lumen and without entering Golgi vesicles in functionally relevant amounts. Our findings indicate that a common mechanism independent of anterograde dissociative carriers is responsible for the traffic of small and large secretory cargo across the Golgi stack.


Figures

Figure 1.
Figure 1.
Human fibroblasts can express and transport both PC-I aggregates and VSVG through the Golgi complex. Human fibroblasts were stimulated to synthesize PC-I and infected with ts045-VSV. After accumulation of both and PC-I and VSVG in the ER at 40°C for 3 h, cells were shifted to 32°C for 9 min and then fixed, permeabilized with saponin, and prepared for immunofluorescence or fixed and prepared for immuno-EM. (A and B) Immunofluorescent double labeling for VSVG (red) and PC-I (green). Both cargoes localize mostly in the Golgi area. The two labeling patterns are very similar. (C) Immuno-EM labeling of PC-I by the preembedding nanogold gold enhancement technique. An aggregate appears as thick cluster of gold particles in a tangential section of a Golgi cisterna. (D) Immuno-EM labeling of VSVG by the same technique. VSVG is distributed throughout the Golgi membranes, including PC-I–containing distensions. Many typical cisternal distensions (*) are seen within the Golgi ribbon (arrows). (E–H) Synchronization protocols. (E) Pulse protocols: cells were kept at 32°C in the presence of AA (50 μg/ml) for 3 h, shifted to 40°C for 3 h (in some experiments 1–2 h), and then shifted to 15°C for 2 h (large pulse), 45 min (intermediate pulse), or 15 min (small pulse), and finally shifted back to 40°C. (F) ER accumulation–chase: cells were kept at 40°C for 3 h in the absence of AA, and then shifted to 32°C in the presence of AA. (G) ER accumulation–pulse: same as for ER accumulation–chase except that cells were shifted back to 40°C after 5 min at 32°C. (H) Exiting wave protocol (Results). Bar: (A and B) 200 nm; (C and D) 2 μm.
Figure 2.
Figure 2.
PC-I and VSVG are transported through the Golgi complex at indistinguishable rates. Human fibroblasts were subjected to different synchronization protocols (see below), fixed at the times indicated in the figure after release of the temperature block, and then double immunolabeled for PC-I and VSVG. For the sake of space, in most panels the two colors are presented only in the merged form. (A–I) Large-pulse protocol. (L–N) Small-pulse protocol. The inset in panel I shows labeling for VSVG on the membrane surface (labeled without permeabilization with an antibody against the lumenal epitope). The colocalization between PC-I and VSVG was significant at all time points. (O–R) Quantification and time course of the passage of VSVG and through the Golgi under the large-, small-, and intermediate-pulse, and exiting-wave protocols. The values were obtained by measuring the average fluorescence intensities (in arbitrary units) of each cargo in the Golgi area and in the nuclear envelope (ER, with average fluorescence of 1). The differences between the Golgi and the ER values for each cargo were then calculated and plotted as a function of time. Clearly, this difference (Golgi minus ER) increases as cargoes exit the ER and enter the Golgi, and then it decreases when the cargoes exit the Golgi for the plasma membrane. The average transit time of the cargoes through the Golgi area is defined as the lag (indicated by the discontinuous line in O and Q) between the half time of the rising phase and that of the decay phase. The transit time was ∼20 min for the large-pulse, and 8–10 min for the small- and intermediate-pulse protocols. The cargo clearance time from the Golgi under the exiting-wave protocol is defined as the lag between the start of the 40°C block and the half time of the decay phase of the curve (R); it was ∼7–8 min. It is apparent that VSVG and PC-I move simultaneously through the Golgi area under all the protocols, whereas the rate of traffic differs between protocols. Each value represents the average of 7–15 independent measurements from at least three different experiments. The SDs did not exceed 15% of the mean. Bar, 10 μm.
Figure 3.
Figure 3.
PC-I and VSVG move through the main Golgi subcompartments (cis-, medial-, and trans-TGN) at indistinguishable rates. Human fibroblasts were fixed at steady state (A–C) or subjected to the small-pulse protocol and fixed at various times after release of the 15°C block (D–N). (A–C) Golgi areas stained for GM130 (A, red) and TGN (B, green); the merged image is shown in C. Note that the patterns of two colors appear very similar in (A) and (B), but they clearly do not overlap (C). (D–N) Cells subjected to the small-pulse protocol were fixed at the times indicated in the figure after releasing the 15°C block and double labeled for VSVG and GM130 (D, G, and L), VSVG and GT (e, h, and m), or VSVG and TGN (f, i, and n). VSVG is red and GM130, GT, and TGN are green. At time 0, VSVG localized in peripheral spots (IC elements) and did not overlap with the Golgi markers (unpublished data). At 3.5 min, VSVG colocalized with GM130 (D) but not with GT (E) and TGN46 (F). Later (7 min), VSVG lost colocalization with GM130 (G) acquired colocalization with GT (H), and did not colocalize with TGN46 (I). Finally (11 min), VSVG lost colocalization with GM130 (L) and GT (M) and acquired colocalization with TGN46 (N). Identical results were obtained by labeling PC-I instead of VSVG (see below), and the two cargoes colocalized perfectly (unpublished data). (O–Q) Quantification and time course of the passage of VSVG and PC-I through the main Golgi subcompartments. The localization of cargoes in each subcompartment was assessed by measuring the degree of overlap of each cargo with the marker of each subcompartment (GM130, GT, and TGN) (see Materials and methods), and is expressed as the percentage of colocalization (percentage of cargo-containing pixels which also contain the appropriate Golgi marker). It is apparent that the two cargoes move together. Each value represents the average of eight to fourteen independent measurements from at least three different experiments. The SDs did not exceed 15% of the mean. Bar: (A–C) 12 μm; (D, F–I, L, and M) 10 μm; (E and H) μm 7,5; (N) 5 μm.
Figure 8.
Figure 8.
Dynamic behavior of VSVG-GFP during intra-Golgi transport. Cell were transfected with VSVG–GFP, placed on glass bottom microwell dishes with coordinated grids, subjected to the small-pulse protocol, and studied, after releasing the 15°C block, by laser scanning confocal microscope and time-lapse analysis. (A) 4 min after the shift, the Golgi spots containing VSVG–GFP in the central Golgi area were masked by the high ER background. (b and c) Repeated bleaching of the whole cell (except the Golgi area, delineated) removed the ER background and made the spotty pattern of the VSVG in the Golgi zone more evident. (d and e) Half of the Golgi area was bleached and observed 1 min (D) and 5 min (E) after bleaching. No fluorescence recovery was observed. (Video 1, available at http://www.jcb.org/cgi/content/full/jcb.200108073/DC1). (f and g) This cell was fixed 7 min after releasing the 15°C block and prepared for correlative video light EM using the nanogold gold enhancement method. The region at the center of the white square in (F) was analyzed (it corresponds to the square is the area enlarged in G). As can be seen in G, the spot represents a stack containing VSVG–GFP in a central cisterna (large white square) Arrowheads indicate nuclear pores. (H–M) Cells were treated as for the experiment in panels B and C and observed at 4 min; (H) Image before bleaching; (I) 7 min; (L) 11 min after releasing the temperature block. At 11 min (when some of the spots were starting to leave the Golgi area) it was fixed an stained for TGN46 (red) and VSVG (green) (M). Many of the spots colocalize with the ribbon, whereas others are probably moving out. Bar: (A–E and H–M) 15 μm; (F) 8 μm; (G) 300 nm.
Figure 5.
Figure 5.
VSVG transits through the Golgi without equilibrating across the stack, i.e., while remaining in the same cisterna. Human fibroblasts and COS-7 cells were subjected to the small-pulse protocol, fixed at the times indicated below after release of the 15°C block, and prepared for immunogold labeling for VSVG (10-nm particles), and the Golgi markers GM130, GT, and TGN46 (5- nm particles). Before the shift, VSVG did not colocalize with Golgi markers (unpublished data). 3 min after the shift (A), VSVG colocalized with GM130; 7 min after the shift, VSVG was located in one or two cisternae at the center of the stack (B) flanked by unlabeled cisternae, or colocalized with GT in trans cisternae (C) but not with GM130 (unpublished data). Note that the cis cisternae were not labeled. 11 min after the shift, VSVG colocalized with TGN46 (D). After 15 min, VSVG had left the stack (E). (F and G) Cells were fixed at 7 min and labeled by the immunoperoxidase technique. The ER accumulation–pulse protocol was used in the experiments in F and G. (G) Two serial sections of a stack containing two labeled central cisternae flanked by unlabeled elements. Bar: (A, D, and E) 130 nm, (B) 80 nm; (C, F, and G) 200 nm.
Figure 6.
Figure 6.
Transit of PC-I aggregates through the Golgi stack. Human fibroblasts were subjected to the small-pulse protocol, fixed at the times indicated below after release of the 15°C block, and prepared for immunogold labeling for PC-I (10-nm particles in A–C, 5-nm particles in D), VSVG (10-nm particles in D) and the Golgi markers GM130, GT, and TGN46 (5-nm particles). 3 min after the shift (A), VSVG colocalized with GM130; 7 min after the shift, VSVG colocalized with GT (B) but not with GM130 (C). Note that GT is present in the membrane surrounding the aggregate (arrows). (D) PC and VSVG colocalize at one pole of the stack. Bar: (A and B) 80 nm; (C) 130 nm; (D) 60 nm.
Figure 4.
Figure 4.
PC-I-containing distensions never dissociate from Golgi cisternae during intra-Golgi traffic. Human fibroblasts were subjected to the large ER accumulation–chase protocol (or to the large-pulse protocol) and fast frozen (A–F) or treated with NEM to inhibit vesicle fusion (G–I). (A–F) 9 min after the shift to 32°C, the cells were fixed by ultra-fast freezing, and then cryosubstituted and embedded into Epon 812. Thick (250 nm) sections of Golgi cisternae were cut, prepared for electron microscopic tomography, and virtual 2–3-nm slices (A–C) were extracted from the tomograms using the IMOD software (Ladinsky et al., 1999). The 3-D reconstruction and surface rendering of the cisternae (yellow) and distensions (red) were performed using the SURFdriver program. The same structure is shown in two orientations (D and F). The image in F was chosen to show a pore in the cisterna which generates the impression of discontinuity between distension and cisterna in one of the virtual sections (arrow). Serial thin (50 nm) sections of Golgi cisternae were cut and used to reconstruct the image in E. (G–I) NEM treatment. 7 min after releasing the temperature block, cells were placed on ice, and medium with (H and I) or without (G) NEM (100 μM) was added for 15 min. After washing on ice, cells were shifted to 40°C again for an additional 3 min, and then fixed and prepared for EM. Tangential section of a cisterna with surrounding vesicles in a control cell (G). Tangential section of a cisterna in a NEM-treated cell; vesicular profiles are much more numerous (three- to fourfold) than in controls (H). PC-I distension connected with a cisternae in a NEM-treated cell (I). *, PC-I–containing distensions. Bar: (A and C–E) 150 nm; (F) 100 nm; (G and H) 300 nm; (I) 200 nm.
Figure 7.
Figure 7.
VSVG and ssHRP are excluded from Golgi vesicles during transit through the Golgi complex. Human fibroblasts (a–c) and COS-7 cells (d–f) were subjected to the ER accumulation–chase protocol (D) or the large (C) or the intermediate (A and B) pulse protocols, fixed 7 min after the release of the temperature block (A–D), and then processed for labeling. In the experiments in (A) and (B) they were labeled for VSVG by the cryo-immunogold technique, in C by the nanogold gold enhance technique, and in D (which shows a tangential thick section), by the preembedding immunoperoxidase method. Also in A, the GM130 protein is labeled (small particles). (e and f) For ssHRP experiments, COS-7 cells were transfected with ssHRP, fixed at steady state, and then processed for detection of HRP. (E) Perpendicular and (F) tangential section. Irrespective of the labeling and sectioning technique, the round (vesicular) profiles (arrows) are almost always devoid of cargo, whereas cisternae are labeled. Bar: (A, D, and E) 110 nm; (B) 120 nm; (C) 90 nm; (F) 200 nm.

Similar articles

Cited by

References

    1. Bannykh, S.I., and W.E. Balch. 1997. Membrane dynamics at the endoplasmic reticulum-Golgi interface. J. Cell Biol. 138:1–4. - PMC - PubMed
    1. Becker, B., B. Bolinger, and M. Melkonian. 1995. Anterograde transport of algal scales through the Golgi complex is not mediated by vesicles. Trends Cell Biol. 5:305–307. - PubMed
    1. Bergmann, J.E. 1989. Using temperature-sensitive mutants of VSV to study membrane protein biogenesis. Methods Cell Biol. 32:85–110. - PubMed
    1. Bonfanti, L., A.A. Mironov, Jr., J.A. Martinez-Menarguez, O. Martella, A. Fusella, M. Baldassarre, R. Buccione, H.J. Geuze, A.A. Mironov, and A. Luini. 1998. Procollagen traverses the Golgi stack without leaving the lumen of cisternae: evidence for cisternal maturation. Cell. 95:993–1003. - PubMed
    1. Bruckner, P., and E.E. Eikenberry. 1984. Procollagen is more stable in cellulo than in vitro. Eur. J. Biochem. 140:397–399. - PubMed

Publication types

MeSH terms