. 2001 Dec 24;155(7):1319-32.
doi: 10.1083/jcb.200107107. Epub 2001 Dec 24.

Marching at the front and dragging behind: differential alphaVbeta3-integrin turnover regulates focal adhesion behavior

Affiliations

Marching at the front and dragging behind: differential alphaVbeta3-integrin turnover regulates focal adhesion behavior

C Ballestrem et al. J Cell Biol. .

Abstract

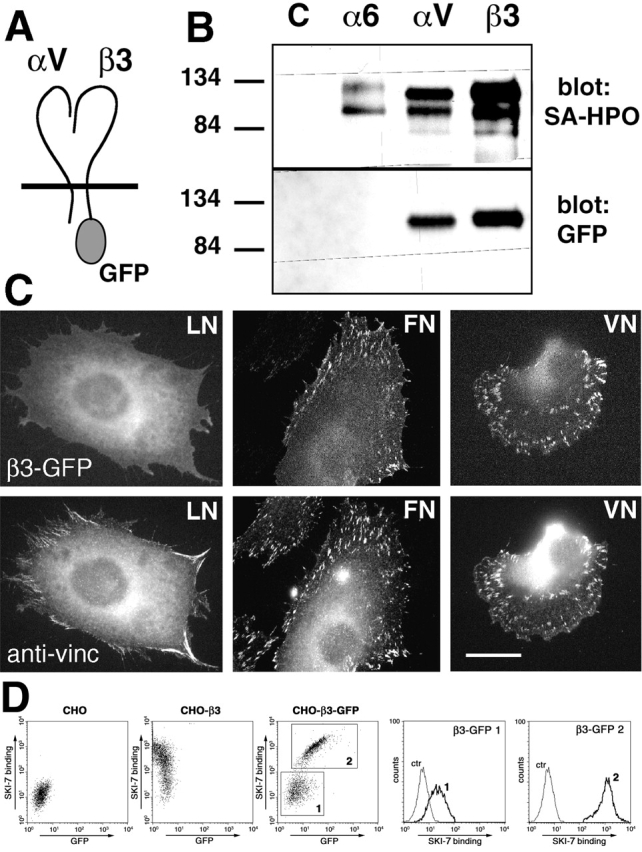
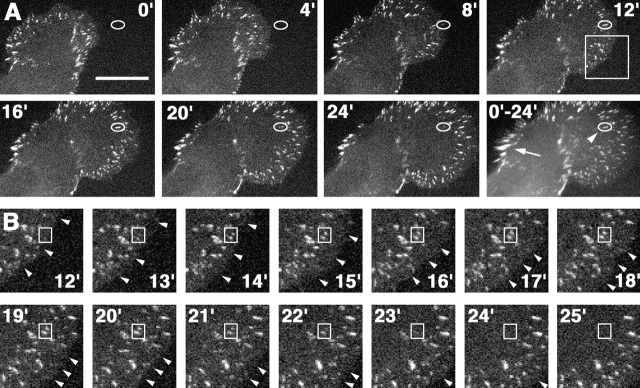
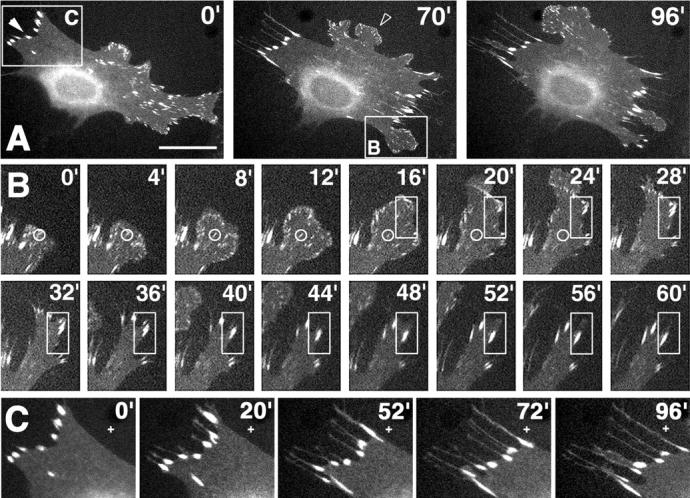
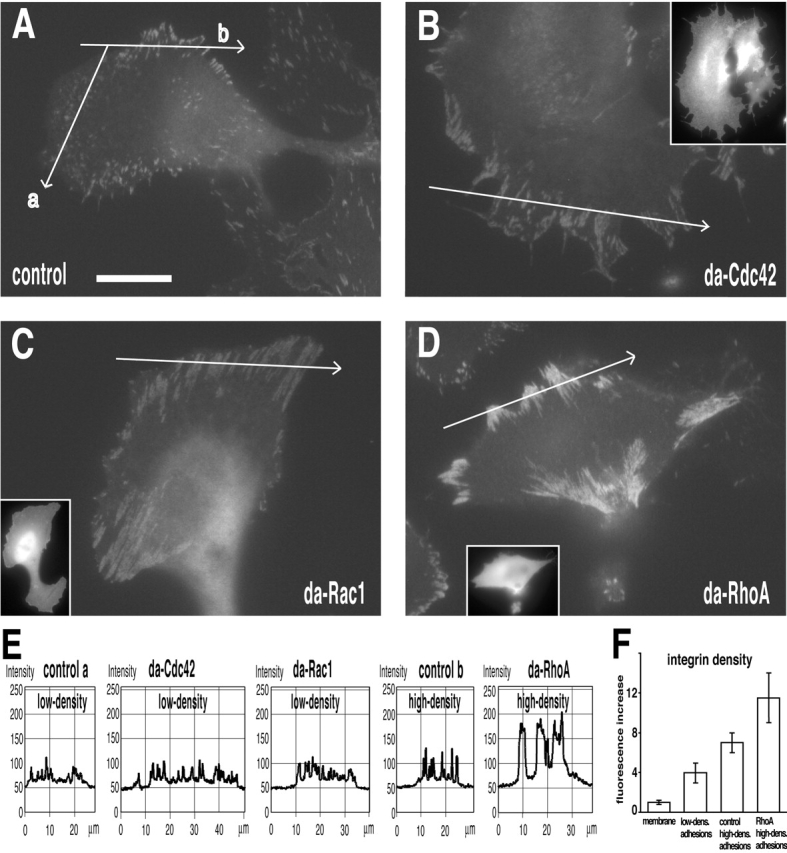
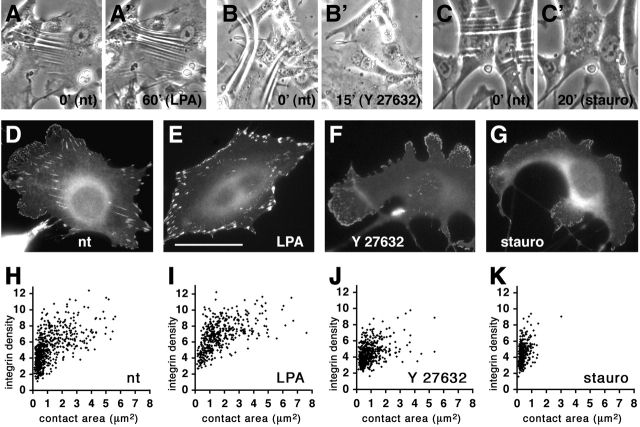
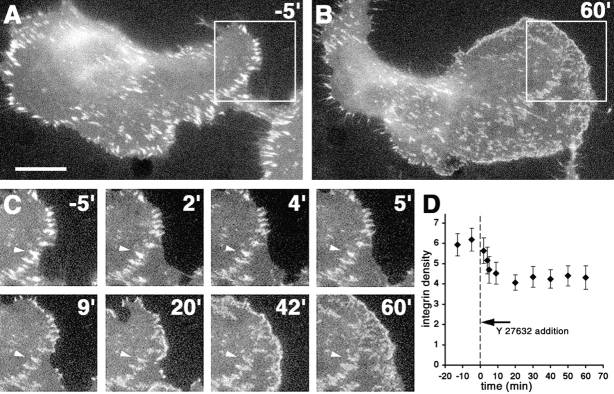
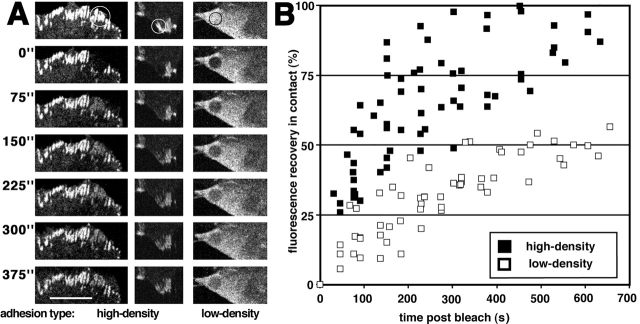
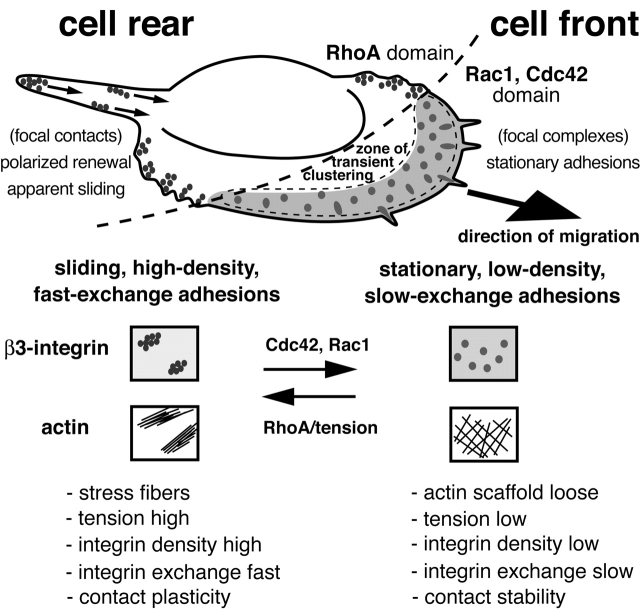
Integrins are cell-substrate adhesion molecules that provide the essential link between the actin cytoskeleton and the extracellular matrix during cell migration. We have analyzed alphaVbeta3-integrin dynamics in migrating cells using a green fluorescent protein-tagged beta3-integrin chain. At the cell front, adhesion sites containing alphaVbeta3-integrin remain stationary, whereas at the rear of the cell they slide inward. The integrin fluorescence intensity within these different focal adhesions, and hence the relative integrin density, is directly related to their mobility. Integrin density is as much as threefold higher in sliding compared with stationary focal adhesions. High intracellular tension under the control of RhoA induced the formation of high-density contacts. Low-density adhesion sites were induced by Rac1 and low intracellular tension. Photobleaching experiments demonstrated a slow turnover of beta3-integrins in low-density contacts, which may account for their stationary nature. In contrast, the fast beta3-integrin turnover observed in high-density contacts suggests that their apparent sliding may be caused by a polarized renewal of focal contacts. Therefore, differential acto-myosin-dependent integrin turnover and focal adhesion densities may explain the mechanical and behavioral differences between cell adhesion sites formed at the front, and those that move in the retracting rear of migrating cells.


Figures

Figure 1.
Figure 1.
The GFP-tagged β3-integrin chain forms functional heterodimers with endogenous αV. (A) Scheme of the αVβ3–GFP-integrin heterodimer. The GFP protein is tagged COOH-terminally to the cytoplasmic domain of the β3 subunit. (B) Immunoprecipitations of cell extracts from surface biotinylated B16 β3–GFP cells. Extracts were precipitated with the indicated antibodies (c, control) and separated under reducing conditions by PAGE followed by transfer onto nitrocellulose membranes. Revelation with either streptavidin coupled horseradish peroxidase (SA-HPO, top) or anti-GFP antibodies (GFP, bottom) demonstrated the typical double-band pattern for integrin heterodimers and the coprecipitated GFP-tagged β3-integrin subunit, respectively. The position of the molecular mass markers is indicated to the left of the blots. (C) Substrate-specific clustering of the αVβ3–GFP-integrin into adhesions sites. B16 β3–GFP cells were plated overnight on glass coverslips, previously coated with 5 μg ml−1 laminin-1 (LN), 5 μg ml−1 fibronectin (FN), or 1 μg ml−1 vitronectin (VN). Cells were subsequently fixed and substrate adhesion sites were revealed by immunohistochemical detection of vinculin. Note that β3–GFP-integrin–positive adhesion sites were only found on fibronectin and vitronectin, which are ligands for αVβ3-integrin. In contrast, β3–GFP-integrin did not cluster on laminin-1, for which it is not a ligand. Because B16 cells use a different type of integrin receptor (α6β1) to adhere to LN than to FN or VN (α5β1, αVβ3), their morphology and migration behavior is different between these substrates (Ballestrem et al., 1998). (D) FACS analysis of nontransfected, β3-, and β3–GFP-transfected CHO cells with a Kistrin–CD31 fusion construct (SKI-7) (Legler et al., 2001). Note that the β3–GFP-transfected CHO clone is not homogeneous, exhibiting cells that lost β3-GFP expression, which reduces their SKI-7 reactivity to endogenous αVβ3-integrin levels (gate 1) (ctr; SKI-7, unpublished data). Bar, 20 μm.
Figure 2.
Figure 2.
Dynamics of β3–GFP-integrin in stable transfected B16 F1 cells. Time-lapse analysis of a B16 β3–GFP cell plated overnight on vitronectin (1 μg ml−1) revealed the transient β3–GFP-integrin clustering and subsequent dispersal in the advancing lamellipodium. A typical β3-integrin cluster (A, circled) appeared close to the leading edge (8′) and remained stationary (12′) until it began to gradually disappear (16′–24′). In retracting parts of the cells, integrin clusters began to slide inward (arrow). To appreciate the relative movement of the different integrin clusters during this time-lapse, an overlay revealed the stationary nature of focal adhesions in the lamellipodia (arrowhead) and the streak-like pattern of sliding focal adhesions in retracting parts of the cell (arrow). In B, a higher temporal and spatial resolution of the boxed area in A (12′) revealed the polymorphic appearance of the stationary integrin clusters (small box as reverence). Although shapes were variable, the fate of the clusters were identical. Arrowheads in B mark the smoothly advancing leading edge of the lamellipodium. Bar, 18 μm.
Figure 3.
Figure 3.
Dynamics of β3–GFP-integrin in stable transfected 3T3 cells. Time-lapse analysis of a 3T3 β3–GFP cell plated overnight on vitronectin (1 μg ml−1), exhibiting cycles of lamellipodia extension (B) followed by cell edge retraction (B and C). During lamellipodia extension, transient stationary small focal adhesions formed behind the leading edge (B, circled focal adhesion). During cessation of the extension phase, small peripheral focal adhesions grew in size and were transformed into inward sliding focal adhesions (B, boxed area). Note that the start of the time lapse in B corresponds to 54′ in A. Continuous inward sliding of large focal adhesions occurred in parallel with cell edge retraction (C). A fiduciary mark on the substrate (C, white crosses) can be used to gauge the speed and position of retracting focal adhesions. Bar, 24 μm.
Figure 4.
Figure 4.
Members of the Rho family of small GTPases regulate β3-integrin clustering differentially. B16 β3–GFP cells transfected with myc-epitope–tagged dominant active forms of Cdc42, Rac1, and RhoA were plated overnight on vitronectin (1 μg ml−1)-coated glass coverslips. Cells were fixed and stained for the expression of the myc-epitope (inserts), and GFP fluorescence images were recorded with identical camera settings in order to appreciate qualitative as well as quantitative differences in the integrin localization pattern. (A) Nontransfected control cells displayed the typical pattern of small low-fluorescent focal adhesions in the lamellipodium (profile a) and larger high-fluorescent focal adhesions at lateral borders and rear of the cell (profile b). (B) Dominant active Cdc42 (da-Cdc42) induced the formation of long, streak-like arrays of low-fluorescent β3 integrin focal adhesions mainly localized in the lamella or periphery of the cell. Similarly, dominant active Rac1 (da-Rac1) induced extensive β3-integrin clustering into low-fluorescent adhesion sites at the periphery of the cell (C). In contrast, dominant active RhoA (da-RhoA) induced a retracted cellular morphology with intensively fluorescent β3-integrin focal adhesions at the cell periphery (D). Fluorescence intensity profiles of the indicated traces in A–D are shown in E. Note that the intensity profiles are similar between focal adhesions in the lamellipodium of control cells and cells transfected with dominant active Cdc42 and Rac1. Peak fluorescent intensities of lateral and rear focal adhesions in control cells are consistently higher compared with lamellipodial focal adhesions, but can increase even more after dominant active RhoA induction. A quantification of the β3-integrin density (fluorescence intensity increase over membrane) is shown in F. Bar, 15 μm.
Figure 5.
Figure 5.
Intracellular tension correlates with integrin density in focal adhesion sites. 3T3 β3–GFP cells were grown on flexible silicone rubber substrates in order to visualize intracellular contractile forces by the appearance of substrate wrinkles. (A–C) Cells were recorded for 1 h under control conditions to confirm stability of the wrinkles (nt). After addition of drugs, the increase in substrate wrinkles (LPA, 10 μM) or their disappearance (Y 27632, 10 μM, or staurosporine, 50 nM) were recorded for the indicated times (A′–C′) (Videos 4–6). In a parallel experiment, 3T3 β3–GFP cells were grown overnight on serum-coated glass coverslips (D, nt), and changes in β3–GFP-integrin localization in response to the above mentioned drugs was determined after 60 min of treatment (E, LPA; F, Y27632; G, staurosporine). The peak β3-integrin density/focal adhesion area relationship was plotted for untreated (H), LPA- (I), Y 27632- (J), and staurosporine- (K)treated cells. Note the shift in the focal adhesion population after addition of agonist. Bar: (A–C), 80 μm; (D–G), 40 μm.
Figure 6.
Figure 6.
Block of intracellular tension reduces focal adhesion density. Time-lapse analysis of β3-integrin fluorescence of focal adhesions in B16 β3–GFP cells after addition of Y-27632 (20 μM) (A, 5′ before addition; B, 60′ after addition). (C) Higher magnification of the boxed area in A demonstrates (a) the reduction in β3-integrin density (fluorescence intensity) during the first 10 min of treatment and (b) the further dispersal of compact β3-integrin focal adhesions into irregularly shaped β3- integrin clusters (arrowhead). (D) The average peak β3-integrin integrin density in the peripheral focal adhesions was measured before and after the addition of the inhibitor. The indicated time refers to the addition of inhibitor. Bar, 20 μm.
Figure 7.
Figure 7.
FRAP reveals different β3-integrin exchange rates in high- versus low-density focal adhesions. (A) Nontransfected or dominant active Rac1 transfected B16 β3–GFP cells were cultured overnight on serum-coated glass coverslips and FRAP was performed on focal adhesions localized to the edge of cells. The bleached area of each series is circled in the first frame and the recovery time (seconds after completion of bleach) indicated to the left. In control cells, immobile (first series) and inward sliding (second series) high-density focal adhesions show almost complete recovery (MF >80%). In cells transfected with dominant active Rac1 (third series) in which low-density focal adhesions were formed, fluorescence recovery was only partial (50% MF), reaching fluorescent levels just slightly above fluorescence intensities of nonclustered β3–GFP-integrin present in the plasma membrane (visible on the right hand side of the frame). Qualitative FRAP curves from several cells (5–8) are displayed in B. Each data point is the median of three to five individual focal adhesions. Bar, 10 μm.
Figure 8.
Figure 8.
Model of cell migration based on differential integrin turnover. Cell migration is driven by Rac1- and Cdc42-dependent actin polymerization in the advancing lamellipodium. Integrin αVβ3 is incorporated in the lamellipodial actin filament lattice (gray shading) to form low-density integrin focal adhesions (focal complexes) (large and irregular shaped dots). These low-density focal adhesions remain stationary in respect to the substrate, firmly anchored in the cytoskeletal scaffold due to their slow turnover rate. These stabilized focal adhesions support the advancing lamellipodium. At the rear of the zone of transient clustering (circumferenced by dotted line), stationary focal adhesions rapidly disperse due to the depolymerization of the lamellipodial actin filament lattice (gray shading). While the cell moves forward, low-density focal adhesions at the lateral edges of the lamellipodium transform into high-density integrin focal adhesions (focal contacts) (accumulation of small dots). This transformation is directed by the acto-myosin–driven local collapse of the lamellipodial actin filaments into stress fibers and provides a means to sense the rigidity of the substrate. Integrins localized in high-density focal adhesions loose their firm cytoskeletal anchor and begin to show fast turnover, creating a great degree of plasticity for modulation of the contact. This plasticity can lead to polarized renewal of focal adhesions, the loss of integrins from the distal edge and their addition at the proximal edge of the contact, giving the illusion of sliding (small arrows).

Similar articles

Cited by

References

    1. Albelda, S.M., S.A. Mette, D.E. Elder, R. Stewart, L. Damjanovich, M. Herlyn, and C.A. Buck. 1990. Integrin distribution in malignant melanoma: association of the beta 3 subunit with tumor progression. Cancer Res. 50:6757–6764. - PubMed
    1. Amano, M., K. Chihara, K. Kimura, Y. Fukata, N. Nakamura, Y. Matsuura, and K. Kaibuchi. 1997. Formation of actin stress fibers and focal adhesions enhanced by Rho-kinase. Science. 275:1308–1311. - PubMed
    1. Anderson, K.I., and R. Cross. 2000. Contact dynamics during keratocyte motility. Curr. Biol. 10:253–260. - PubMed
    1. Axelrod, D., D.E. Koppel, J. Schlessinger, E. Elson, and W.W. Webb. 1976. Mobility measurement by analysis of fluorescence photobleaching recovery kinetics. Biophys. J. 16:1055–1069. - PMC - PubMed
    1. Balaban, N.Q., U.S. Schwarz, D. Riveline, P. Goichberg, G. Tzur, I. Sabanay, D. Mahalu, S. Safran, A. Bershadsky, L. Addadi, and B. Geiger. 2001. Force and focal adhesion assembly: a close relationship studied using elastic micropatterned substrates. Nat. Cell Biol. 3:466–472. - PubMed

Publication types

Substances