. 2002 Jan 1;22(1):167-75.
doi: 10.1523/JNEUROSCI.22-01-00167.2002.

Synaptic activity-induced conversion of intronic to exonic sequence in Homer 1 immediate early gene expression

Affiliations

Synaptic activity-induced conversion of intronic to exonic sequence in Homer 1 immediate early gene expression

Daniele Bottai et al. J Neurosci. .

Abstract

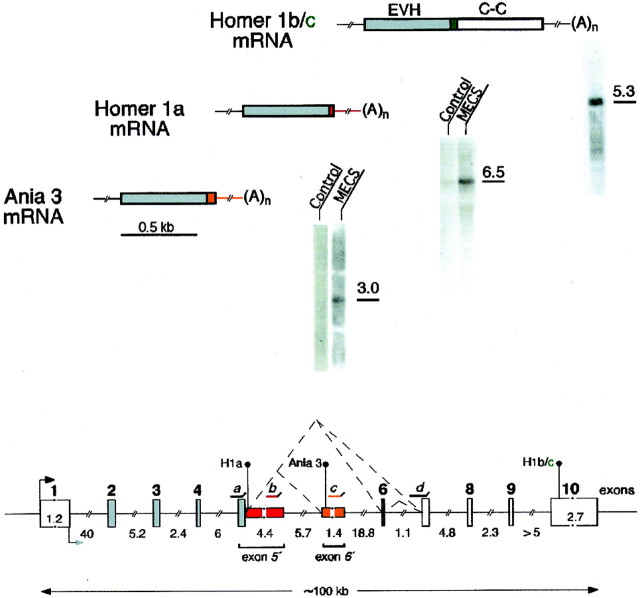
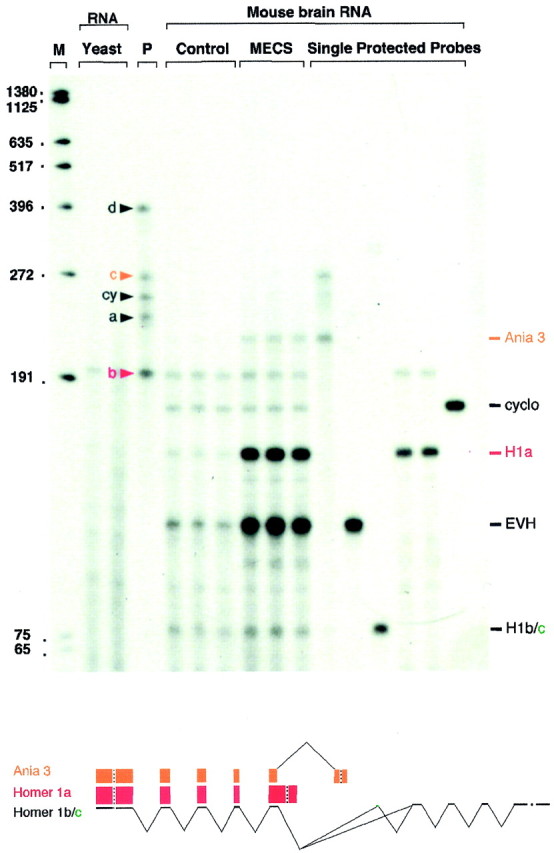
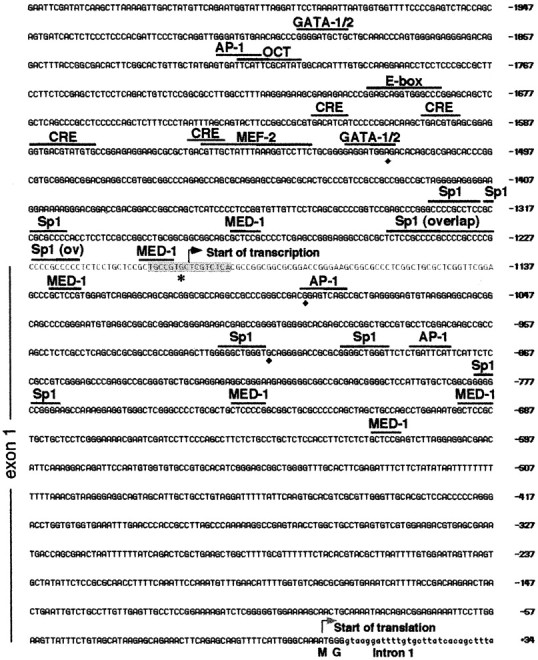
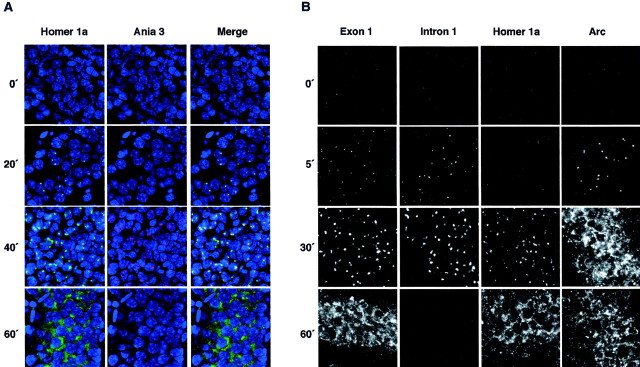
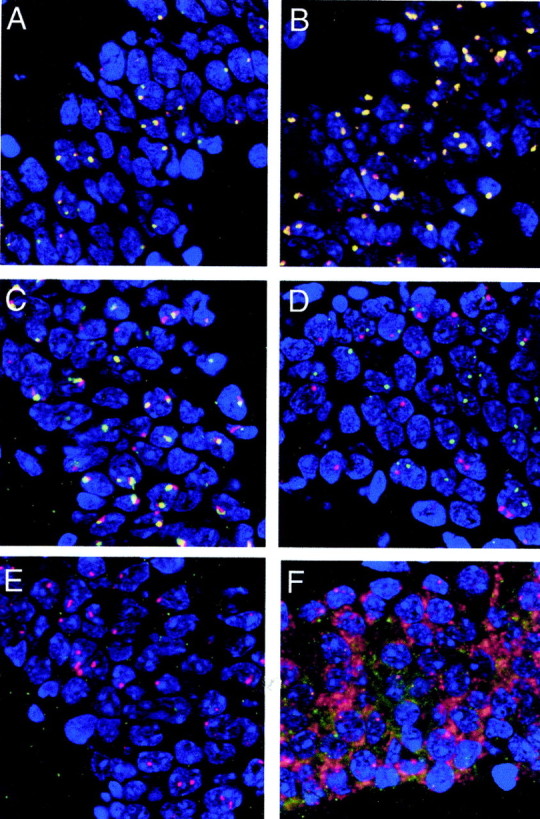
Three Homer genes regulate the activity of metabotropic glutamate receptors mGluR1a and mGluR5 and their coupling to releasable intracellular Ca2+ pools and ion channels. Only the Homer 1 gene evolved bimodal expression of constitutive (Homer 1b and c) and immediate early gene (IEG) products (Homer 1a and Ania 3). The IEG forms compete functionally with the constitutive Homer proteins. The complex expression of the Homer 1 gene, unique for IEGs, focused our attention on the gene organization. In contrast to most IEGs, which have genes that are <5 kb, the Homer 1 gene was found to span approximately 100 kb. The constitutive Homer 1b/c forms are encoded by exons 1-10, whereas the IEG forms are encoded by exons 1-5 and parts of intron 5. RNase protection demonstrated a >10-fold activity-dependent increase in mRNA levels exclusively for the IEG forms. Moreover, fluorescent in situ hybridization documented that new primary Homer 1 transcripts are induced in neuronal nuclei within a few minutes after seizure, typical of IEGs, and that Homer 1b-specific exons are excluded from the activity-induced transcripts. Thus, at the resting state of the neurons, the entire gene is constitutively transcribed at low levels to yield Homer 1b/c transcripts. Neuronal activity sharply increases the rate of transcription initiation, with most transcripts now ending within the central intron. These coordinate transcriptional events rapidly convert a constitutive gene to an IEG and regulate the expression of functionally different Homer 1 proteins.


Figures

Fig. 1.
Fig. 1.
Homer 1 gene and transcripts. The mRNAs encoding Homer 1b/c, Homer 1a, and Ania 3 are depicted schematically next to Northern blots showing these transcripts in brain RNA from naïve (Control) and MECS-stimulated mice (Homer 1b/c, control only). The open reading frames in the mRNAs areboxed and structured by shading andcolor to show the different functional domains and indicate their origin within the Homer 1 gene shown below.EVH, EVH1 domain, lightly shaded;C-C, coiled-coil domain, white box; the alternatively spliced exon 6 for Homer 1c is shown ingreen. The intron 5 origin of sequences in Homer 1a and Ania 3 mRNA is indicated by red andorange. The Homer 1 gene encompasses ∼100 kb and is structured into 10 exons, which are boxed andnumbered in bold. The exons are drawn to scale (see bar under Ania 3 mRNA), except for exons 1 and 10, for which sizes in kilobases are shown inside theboxes. Shading and colorof exons correspond to those in mRNAs. The putative transcriptional initiation site is depicted by a bent arrow at the beginning of exon 1; the translational start at the 3′ end of exon 1 is shown by a lightly shaded arrow. The translational stops for Homer 1a (H1a) and Ania 3 as well as for Homer 1b/c (H1b/c) are indicated by black diamonds. Intron sizes in kilobases are listed under the slashedintron line. Intron 5 comprises 30261 nucleotides and is here divided into four segments (4.4 kb of Homer 1a 3′ UTR, 5.7 kb up to Ania 3, 1.4 kb of Ania 3-specific sequence, and 18.8 kb to exon 6). The Homer 1a-specific exon 5′ extends exon 5 by intron 5 sequence. The Ania 3-specific exon 6′ sits within intron 5. The alternative splicing of exon 6 and the activity-dependent splice into Ania 3 sequence within intron 5 are indicated by broken lines.ad, Probes used for RNase protection, with exogenous vector sequences depicted by small upward lines.
Fig. 2.
Fig. 2.
Constitutive and activity-dependent Homer 1 gene transcription assessed by RNase protection. The relative levels of different Homer 1 transcripts in forebrain total RNA from mice treated by MECS and from control mice were determined with a mixture of four RNA probes (ad; see Fig. 1) specific for exon 5 (a, EVH domain common to all Homer 1 forms), Homer 1a 3′ UTR (b), Ania 3 3′ UTR (c), and exon 7 (d, specific for Homer 1b/c). A probe for cyclophilin (cy;cyclo) was included as internal standard. Unprotected and protected probes were resolved by gel electrophoresis.M (lane 1), Molecular weight markers with nucleotide lengths indicated on the left. Yeast RNA (lanes 2, 3), No protected fragments. P (lane 4), Unprotected probes. Control (lanes 5–7), RNA in triplicate from control mouse. MECS (lanes 8–10), RNA in triplicate from MECS-treated mouse.Single Protected Probes (lanes 11–16), Sizes of the individual protected probes, indicated on the right. Note that small amounts of undigested probes appear in lanes labeled Yeast andSingle Protected Probes, but these do not interfere with the protected signals. The results from three RNase protection assays were quantified and summarized graphically by different transcript widths corresponding to averaged increases after MECS of the constitutive and activity-dependent Homer 1 transcripts.
Fig. 3.
Fig. 3.
Promoter region, putative transcriptional start sites, and first exon of the mouse Homer 1 gene. Negatively numbered nucleotides are upstream of the first nucleotide (bent shaded arrow) of the translational initiation codon ATG (see also Table 1). Intron 1 nucleotides are in lowercase. Transcriptional start sites determined by 5′-RACE are indicated in the sequence. The shaded sequence with the bent arrow represents the region where the majority of RACE fragments had their 5′ ends. This sequence also harbors the 5′ end (∗) of Ania 3 cDNA of rat (Berke et al., 1998). The extent of exon 1 based on these start sites is indicated on the left. Other start sites seen less frequently are indicated by black diamonds. Selected cis-acting sequence motifs are overlined.
Fig. 4.
Fig. 4.
Fluorescent in situ hybridization.A, Time course of induction by MECS of Homer 1a and Ania 3 transcripts in the granule cell layer of the hippocampal dentate gyrus. The Homer 1a probe is detected by CY5 fluorochrome (green), and Ania 3 is detected by CY3 (red). Positionally identical signals becomeyellow after merging. Nuclei are stained with YOYO-1, here depicted as blue. Homer labeling appears in discrete intranuclear foci 20 min after MECS, indicating sharply increased rates of Homer 1 gene transcription. Some nuclei show two adjacent foci, demonstrating transcription at both Homer 1 alleles. The signals become more diffuse over time because of transcript processing and nuclear export. The higher levels of Homer 1a transcripts and the signal spread prevent the successful merging of Homer 1a and Ania 3 specific signals at 60 min after MECS. B, Time course of induction of the IEGs Arc and Homer after MECS, using for Homer 1 the probes Exon 1, Intron 1, and Homer 1a (3′ UTR). Note that the 5′ probes reveal comparable induction kinetics for Homer and Arc transcripts, and that the intron 1 signal is lost by 60 min after MECS. Arc-specific signals diffuse by the time the Homer 1a 3′ UTR sequence becomes visible. All signals are from probe-specific color channels only, converted to gray scale.
Fig. 5.
Fig. 5.
Transcript colocalization by fluorescent in situ hybridization. A, Homer 1 exon 1,red channel; Homer 1 intron 1, green channel; colocalization indicated by yellow; 5 min after MECS. B, Probes as in A; 30 min after MECS. C, Homer 1 exon 1, red channel; Homer 1a 3′ UTR, green channel; 30 min after MECS. D, Arc, red channel; Homer 1 exon 1, green channel; 5 min after MECS; note that Homer 1 and Arc are activity induced in the same nucleus but appear as separate foci attributable to different chromosomal locations.E, Homer 1a 3′ UTR, red channel; Homer 1b, green channel; 30 min after MECS. F, Probes as in E; 60 min after MECS. Note that Homer 1a signal has spread from nucleus to cytoplasm without the appearance of Homer 1b-specific intranuclear foci.

References

    1. Ageta H, Kato A, Hatakeyama S, Nakayama K, Isojima Y, Sugiyama H. Regulation of the level of Vesl-1S/Homer-1a proteins by ubiquitin-proteasome proteolytic systems. J Biol Chem. 2001;276:15893–15897. - PubMed
    1. Ango F, Prezeau L, Muller T, Tu JC, Xiao B, Worley PF, Pin JP, Bockaert J, Fagni L. Agonist-independent activation of metabotropic glutamate receptors by the intracellular protein Homer. Nature. 2001;411:962–965. - PubMed
    1. Beneken J, Tu JC, Xiao B, Nuriya M, Yuan JP, Worley PF, Leahy DJ. Structure of the Homer EVH1 domain-peptide complex reveals a new twist in polyproline recognition. Neuron. 2000;26:143–154. - PubMed
    1. Berke JD, Paletzki RF, Aronson GJ, Hyman SE, Gerfen CR. A complex program of striatal gene expression induced by dopaminergic stimulation. J Neurosci. 1998;18:5301–5310. - PMC - PubMed
    1. Blackwell TK, Kretzner L, Blackwood EM, Eisenman RN, Weintraub H. Sequence-specific DNA binding by the c-Myc protein. Science. 1990;250:1149–1151. - PubMed

Publication types

MeSH terms

Associated data

LinkOut - more resources