. 2002 Jan 1;22(1):200-8.
doi: 10.1523/JNEUROSCI.22-01-00200.2002.

Short-term retrograde inhibition of GABAergic synaptic currents in rat Purkinje cells is mediated by endogenous cannabinoids

Affiliations

Short-term retrograde inhibition of GABAergic synaptic currents in rat Purkinje cells is mediated by endogenous cannabinoids

Marco A Diana et al. J Neurosci. .

Abstract

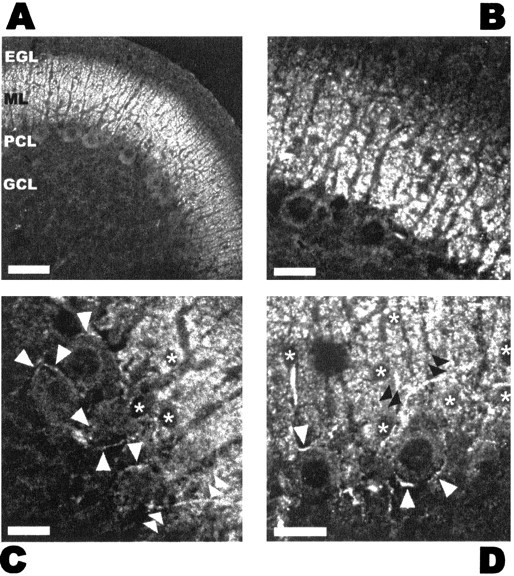
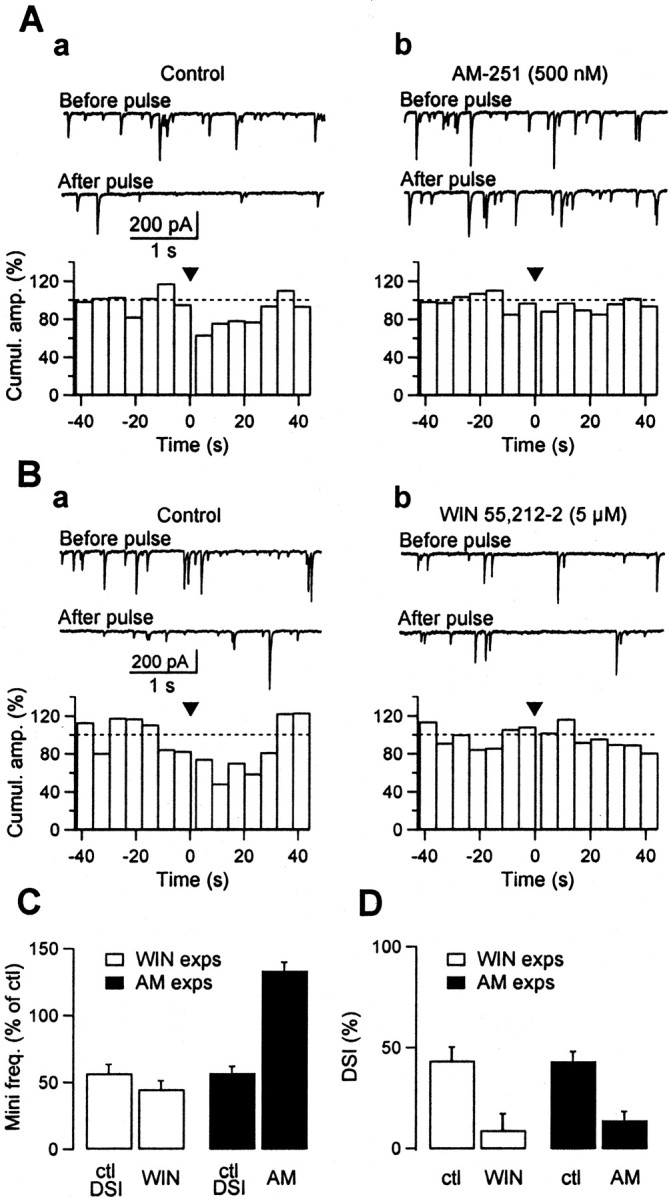
Depolarization-induced suppression of inhibition (DSI) is a form of short-term plasticity of GABAergic synaptic transmission that is found in cerebellar Purkinje cells and hippocampal CA1 pyramidal cells. DSI involves the release of a calcium-dependent retrograde messenger by the somatodendritic compartment of the postsynaptic cell. Both glutamate and endogenous cannabinoids have been proposed as retrograde messenger. Here we show that, in cerebellar parasagittal slices, type 1 cannabinoid receptors (CB1Rs) are expressed at high levels in axons of GABAergic interneurons and in presynaptic terminals onto Purkinje cells. Application of the cannabinoid antagonist AM-251 (500 nm) leads to the abolition of the DSI of evoked currents (eIPSCs) recorded in paired recordings and to a strong reduction of the DSI of TTX-insensitive miniature events (mIPSCs) recorded from Purkinje cells. Furthermore, the CB1R agonist WIN 55-212,2 (5 microm) induces a presynaptic inhibition of synaptic currents similar to that occurring during DSI, as well as an occlusion of DSI after stimulation of Purkinje cells. Moreover, WIN 55-212,2 reduces the calcium transients evoked in presumed presynaptic varicosities by short trains of action potentials. Our results indicate that DSI is mediated by the activation of presynaptic CB1Rs and that an endogenous cannabinoid is a likely candidate retrograde messenger in this preparation. They further suggest that DSI involves distinct presynaptic modifications for eIPSCs and mIPSCs, including an inhibition of action potential-evoked calcium rises.


Figures

Fig. 1.
Fig. 1.
CB1R localization in the cerebellum of young rats.A–D, Immunohistochemical detection of CB1Rs in the cerebellum of a 12-d-old rat, using an antibody raised against the C-terminal portion of the protein. Maximal expression can be seen in the ML. A, B, Purkinje cell somata (large cell bodies with big dark nucleus in the PCL), dendrites, and Bergmann glia fibers appear unstained. The strong punctate signal likely comes from parallel fibers, which run perpendicular to the plane of the slice. The EGL, which is still present at this developmental stage, is devoid of protein, probably because of absence of parallel fibers and GABAergic fibers. A series of small, unstained somata can be seen in the bottom part of the ML, presumably basket cell bodies.C, D, At high magnification near the PCL, punctate staining of the ML is clearly visible together with unstained cell somata (asterisks) corresponding to basket–stellate cells and/or migrating granule cells. White arrowheads indicate the fluorescence surrounding Purkinje cell soma, which is presumably attributable to basket cell synaptic terminals. Intensely stained basket–stellate cell axons contacting Purkinje cell somata are indicated by white(C) and black(D) double arrowheads. Scale bars:A, 50 μm; B–D, 20 μm.EGL, External germinal layer; ML,molecular layer; PCL, Purkinje cell layer;GCL, granule cell layer.
Fig. 2.
Fig. 2.
In paired recordings DSI is occluded by the CB1R agonist WIN 55,212–2 and completely prevented by the CB1R antagonist AM-251. Paired recordings were performed between presynaptic stellate–basket cells and postsynaptic Purkinje cells. The presynaptic cell was recorded using perforated patch. DSI was assayed by depolarizing Purkinje cells to 0 mV for 1 sec at 3–4 min intervals. eIPSCs were elicited every 5 sec. A, Effect of WIN 55,212–2. Aa, Presynaptic and postsynaptic current sweeps averaged from one DSI trial, before (from 18 eIPSCs;black trace), and after (first three post-depolarization IPSCs; gray trace) the depolarizing pulse.Top, In control saline, the presynaptic current is not altered by the DSI-inducing protocol, whereas the postsynaptic current is strongly decreased (average control DSI: 86.9 ± 2.6%;n = 6 DSI trials). Bottom, In the presence of 5 μm WIN 55,212–2, the postsynaptic current is markedly reduced (note 10-fold change in vertical scale). In addition, the gray and black postsynaptic traces are now superimposed, indicating an abolition of DSI (average DSI in WIN 55,212–2: 15.1 ± 8.5%; n = 4 trials). Ab, Peak amplitude of individual eIPSCs plotted over time, same experiment as in Aa.t = 0 min corresponds to Purkinje cell break-in.Open circles correspond to control eIPSCs, andclosed circles to eIPSCs measured 0–90 sec after the DSI protocol. Inset, Averaged paired pulse currents elicited by 50 msec interpulse interval stimulations. Currents in control saline (average of 77 traces; black trace) and in WIN 55–212,2 (average of 55 traces; gray trace) have been normalized with respect to the first paired evoked current in the control trace. In this experiment the paired pulse ratio increases from 113% in the control to 182% in WIN 55–212,2, calculated as the ratio between the amplitude of the averaged second eIPSC and the amplitude of the averaged first eIPSC. B, Effect of AM-251.Ba, In another experiment, the initial amount of DSI observed in the control was 89.9 ± 2.6% (n = 9 DSI trials). Perfusion of 500 nm AM-251 slightly increased the amplitude of eIPSCs and markedly reduced DSI (to 15.2 ± 5.0%; n = 10 trials,bottom). In this experiment no leak subtraction was applied to the presynaptic traces, in contrast to A.Bb, Time plot of the effects of AM-251 for the same experiment. C, Histograms summarizing five experiments where the pharmacological test was with WIN 55–212,2 (white bars) and six experiments with AM-251 (black bars); values are normalized relatively to the amplitude of eIPSC observed in control saline. “ctl DSI” bars are the mean eIPSC amplitudes during DSI in control saline. WIN andAM bars are the mean eIPSC amplitudes, respectively in the presence of WIN55,212–2 and AM-251. Note that WIN 55–212,2 and the DSI protocol reduce the eIPSCs to about the same level, whereas AM-251 does not modify the amplitude of eIPSC. D, Same experiments as in C. Comparison of the amount of DSI observed in control conditions (control), and in the presence of either WIN 55–212,2 (WIN) or AM-251 (AM). Notice the complete abolition of DSI in AM-251.
Fig. 3.
Fig. 3.
Effects of WIN 55,212–2 and of AM-251 on DSI of mIPSCs. Here DSI of mIPSCs was measured in TTX after a 1-sec-long Purkinje cell depolarization. Sweeps are examples of currents recorded in Purkinje cells. A, Effects of AM-251.Aa, In control saline, the depolarizing pulse resulted in an inhibition of mIPSC frequency. Histogram: Averaged response to four DSI trials. DSI was measured as the percentage decrease in cumulative amplitude over a period of 2.5–12.5 sec after the depolarizing pulse. Ab, In the presence of 500 nm AM-251, DSI is markedly reduced (average histogram for three trials). B, Effects of WIN 55,212–2.Ba, DSI in control saline. Bb, After perfusion with 5 μm WIN 55,212–2, mIPSC frequency was markedly reduced, and DSI was abolished. C, Summary results from four experiments with WIN 55–212,2 (white bars) and five experiments with AM-251 (black bars). Ordinates indicate frequencies of mIPSCs (calculated over 5 min recordings) normalized with respect to the frequency of mIPSC observed in control saline before DSI. “ctl DSI” bars are the mean mIPSCs frequency during DSI in control saline. WIN andAM bars are the mean mIPSCs frequency, respectively in the presence of WIN55,212–2 and AM-251. D, Same experiments as in C. Comparison of the amount of DSI observed in control conditions (ctl) and in the presence of either WIN 55–212,2 (WIN) or AM-251 (AM).
Fig. 4.
Fig. 4.
WIN 55,212–2 inhibits presynaptic calcium transients. A, Ca2+ transients observed in the axonal tree of an interneuron loaded with OG-1 (250 μm). Left panel, Image in basal conditions. Right panel, Peak response to a train of four action potentials in control saline. White dotted lines show the position in the slice of two Purkinje cell somata contacted by axonal lateral branches of the recorded cell. The interneuron soma is ∼20 μm above, out of the imaged area.B, Analysis of Ca2+ transients for the same experiment as in A. Traces obtained in control and in the presence of 5 μm WIN55,212–2 are labeled inblack and red, respectively.Top, Somatic action currents recorded during a train of four depolarizations. Bottom, Average ΔF/F0 signals for two different stimulations calculated from the 10 hotspots indicated bywhite arrowheads in A. Thevertical black arrow indicates the time when the four spike stimulus was applied. C, Time course of the effects of WIN 55–212,2 for the same experiment. The points correspond to mean ± SEM of maximal ΔF/F0 changes after stimulation from the 10 hot spots. a andb labels correspond to the data illustrated inB in black and red, respectively. Values were normalized with respect to the four average control ΔF/F0.

Similar articles

Cited by

References

    1. Alger BE, Pitler TA, Wagner JJ, Martin LA, Morishita W, Kirov SA, Lenz RA. Retrograde signalling in depolarization-induced suppression of inhibition in rat hippocampal CA1 cells. J Physiol (Lond) 1996;496:197–209. - PMC - PubMed
    1. Altman J, Bayer SA. Development of the cerebellar system: in relation to its evolution, structure, and functions. CRC; Boca Raton, FL: 1997.
    1. Cheramy A, Leviel V, Glowinski J. Dendritic release of dopamine in the substantia nigra. Nature. 1981;289:537–542. - PubMed
    1. Di Marzo V, Fontana A, Cadas H, Schinelli S, Cimino G, Schwartz JC, Piomelli D. Formation and inactivation of endogenous cannabinoid anandamide in central neurons. Nature. 1994;372:686–691. - PubMed
    1. Drake CT, Terman GW, Simmons ML, Milner TA, Kunkel DD, Schwartzkroin PA, Chavkin C. Dynorphin opioids present in dentate granule cells may function as retrograde inhibitory neurotransmitters. J Neurosci. 1994;14:3736–3750. - PMC - PubMed

Publication types

MeSH terms

LinkOut - more resources