Changes in gene expression linked to methamphetamine-induced dopaminergic neurotoxicity
- PMID: 11756511
- PMCID: PMC6757595
- DOI: 10.1523/JNEUROSCI.22-01-00274.2002
Changes in gene expression linked to methamphetamine-induced dopaminergic neurotoxicity
Abstract
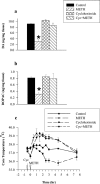
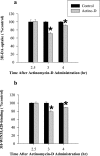
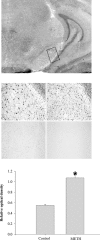
The purpose of these studies was to examine the role of gene expression in methamphetamine (METH)-induced dopamine (DA) neurotoxicity. First, the effects of the mRNA synthesis inhibitor, actinomycin-D, and the protein synthesis inhibitor, cycloheximide, were examined. Both agents afforded complete protection against METH-induced DA neurotoxicity and did so independently of effects on core temperature, DA transporter function, or METH brain levels, suggesting that gene transcription and mRNA translation play a role in METH neurotoxicity. Next, microarray technology, in combination with an experimental approach designed to facilitate recognition of relevant gene expression patterns, was used to identify gene products linked to METH-induced DA neurotoxicity. This led to the identification of several genes in the ventral midbrain associated with the neurotoxic process, including genes for energy metabolism [cytochrome c oxidase subunit 1 (COX1), reduced nicotinamide adenine dinucleotide ubiquinone oxidoreductase chain 2, and phosphoglycerate mutase B], ion regulation (members of sodium/hydrogen exchanger and sodium/bile acid cotransporter family), signal transduction (adenylyl cyclase III), and cell differentiation and degeneration (N-myc downstream-regulated gene 3 and tau protein). Of these differentially expressed genes, we elected to further examine the increase in COX1 expression, because of data implicating energy utilization in METH neurotoxicity and the known role of COX1 in energy metabolism. On the basis of time course studies, Northern blot analyses, in situ hybridization results, and temperature studies, we now report that increased COX1 expression in the ventral midbrain is linked to METH-induced DA neuronal injury. The precise role of COX1 and other genes in METH neurotoxicity remains to be elucidated.
Figures


Similar articles
-
Effect of temperature on dopamine transporter function and intracellular accumulation of methamphetamine: implications for methamphetamine-induced dopaminergic neurotoxicity.J Neurosci. 2000 Oct 15;20(20):7838-45. doi: 10.1523/JNEUROSCI.20-20-07838.2000. J Neurosci. 2000. PMID: 11027249 Free PMC article.
-
Methamphetamine-induced degeneration of dopaminergic neurons involves autophagy and upregulation of dopamine synthesis.J Neurosci. 2002 Oct 15;22(20):8951-60. doi: 10.1523/JNEUROSCI.22-20-08951.2002. J Neurosci. 2002. PMID: 12388602 Free PMC article.
-
Methamphetamine-induced alterations in dopamine transporter function.Brain Res. 1998 Jan 26;782(1-2):219-27. doi: 10.1016/s0006-8993(97)01281-x. Brain Res. 1998. PMID: 9519266
-
Methamphetamine- and 1-methyl-4-phenyl- 1,2,3, 6-tetrahydropyridine-induced dopaminergic neurotoxicity in inducible nitric oxide synthase-deficient mice.Synapse. 1999 Dec 15;34(4):305-12. doi: 10.1002/(SICI)1098-2396(19991215)34:4<305::AID-SYN6>3.0.CO;2-#. Synapse. 1999. PMID: 10529724
-
Substance P and cholecystokinin regulate neurochemical responses to cocaine and methamphetamine in the striatum.Life Sci. 2003 Jun 27;73(6):727-39. doi: 10.1016/s0024-3205(03)00393-x. Life Sci. 2003. PMID: 12801594 Review.
Cited by
-
A threshold neurotoxic amphetamine exposure inhibits parietal cortex expression of synaptic plasticity-related genes.Neuroscience. 2007 Jan 5;144(1):66-76. doi: 10.1016/j.neuroscience.2006.08.076. Epub 2006 Oct 13. Neuroscience. 2007. PMID: 17049170 Free PMC article.
-
Methamphetamine modulates gene expression patterns in monocyte derived mature dendritic cells: implications for HIV-1 pathogenesis.Mol Diagn Ther. 2006;10(4):257-69. doi: 10.1007/BF03256465. Mol Diagn Ther. 2006. PMID: 16884330
-
Epigenetic Effects Induced by Methamphetamine and Methamphetamine-Dependent Oxidative Stress.Oxid Med Cell Longev. 2018 Jul 22;2018:4982453. doi: 10.1155/2018/4982453. eCollection 2018. Oxid Med Cell Longev. 2018. PMID: 30140365 Free PMC article. Review.
-
Identification and characterization of metallothionein-1 and -2 gene expression in the context of (+/-)3,4-methylenedioxymethamphetamine-induced toxicity to brain dopaminergic neurons.J Neurosci. 2004 Aug 11;24(32):7043-50. doi: 10.1523/JNEUROSCI.1626-04.2004. J Neurosci. 2004. PMID: 15306638 Free PMC article.
-
Systems-scale analysis reveals pathways involved in cellular response to methamphetamine.PLoS One. 2011 Apr 20;6(4):e18215. doi: 10.1371/journal.pone.0018215. PLoS One. 2011. PMID: 21533132 Free PMC article.
References
-
- Albers DS, Sonsalla PK. Methamphetamine-induced hyperthermia and dopaminergic neurotoxicity in mice: pharmacological profile of protective and nonprotective agents. J Pharmacol Exp Ther. 1995;275:1104–1114. - PubMed
-
- Ali SF, Newport RR, Holson W, Slikker W, Jr, Bowyer JF. Low environmental temperatures or pharmacologic agents that produce hyperthermia decrease methamphetamine neurotoxicity in mice. Ann NY Acad Sci. 1995;765:338. - PubMed
-
- Ali SF, Newport GD, Slikker W., Jr Methamphetamine-induced dopaminergic toxicity in mice. Role of environmental temperature and pharmacological agents. Ann NY Acad Sci. 1996;801:187–198. - PubMed
-
- Badiani A, Oates MM, Day HE, Watson SJ, Akil H, Robinson TE. Environmental modulation of amphetamine-induced c-fos expression in D1 versus D2 striatal neurons. Behav Brain Res. 1999;103:203–209. - PubMed
Publication types
MeSH terms
Substances
Grants and funding
LinkOut - more resources
Full Text Sources
Medical
