. 2002 Jan 1;22(1):305-14.
doi: 10.1523/JNEUROSCI.22-01-00305.2002.

Differential metabolic activity in the striosome and matrix compartments of the rat striatum during natural behaviors

Affiliations

Differential metabolic activity in the striosome and matrix compartments of the rat striatum during natural behaviors

Lucy L Brown et al. J Neurosci. .

Abstract

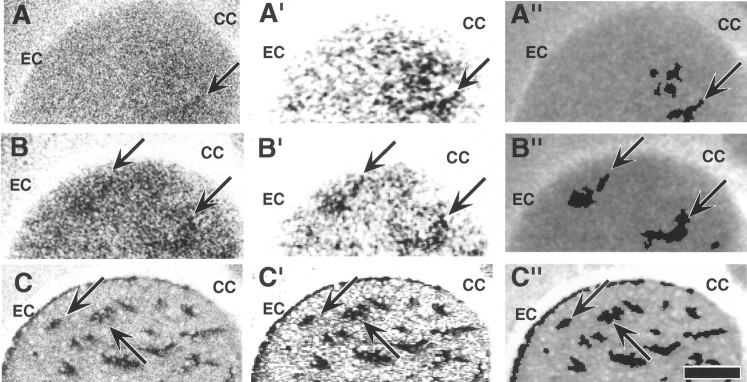
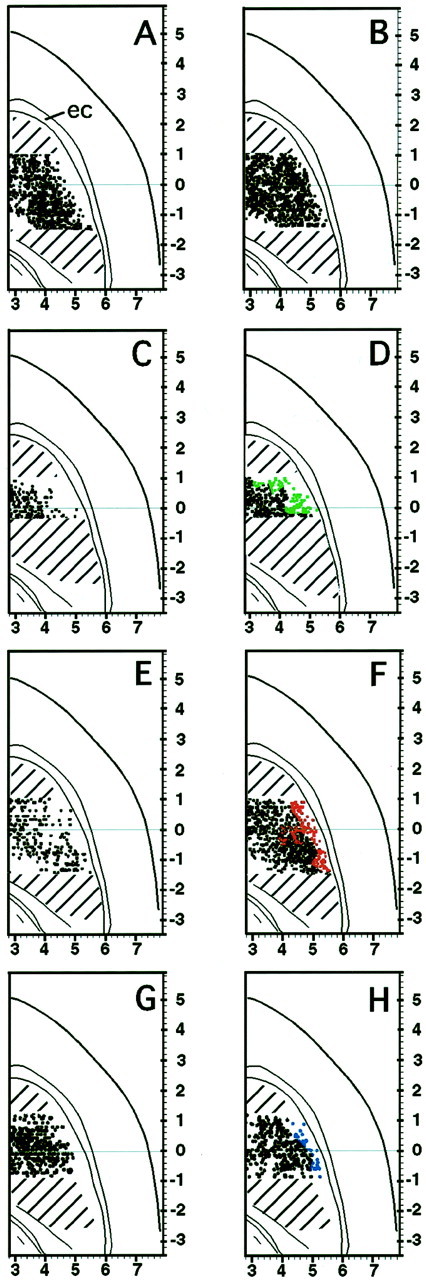
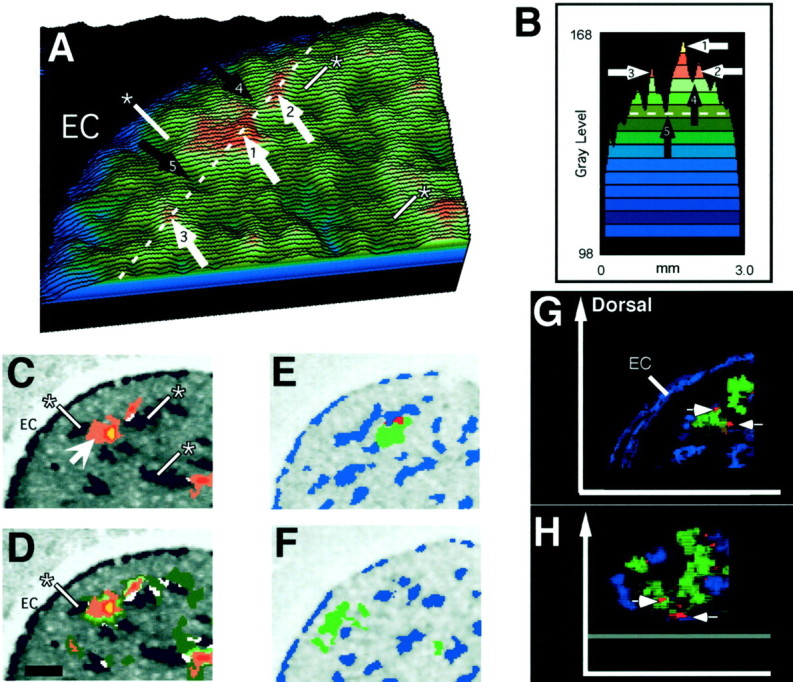
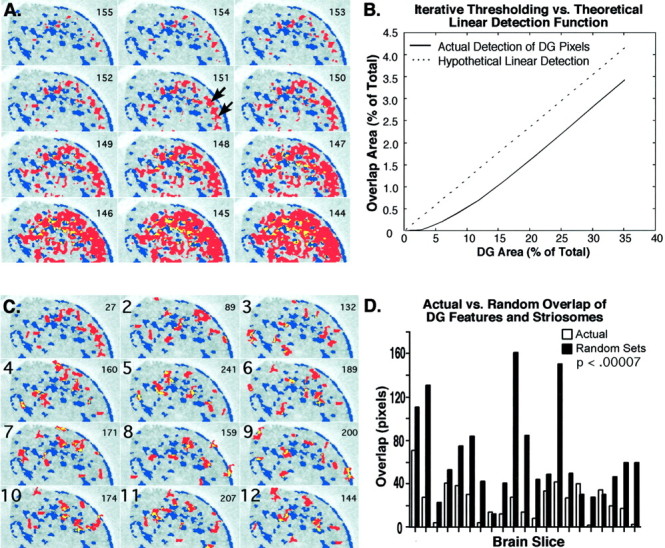
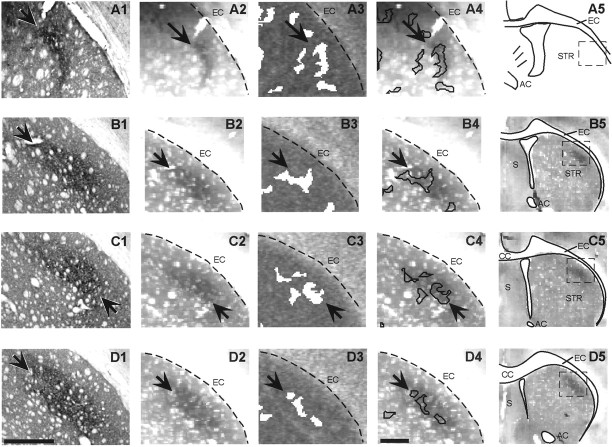
The striosome and matrix compartments of the striatum are clearly identified by their neurochemical expression patterns and anatomical connections. To determine whether these compartments are distinguishable functionally, we used [14C]deoxyglucose metabolic mapping in the rat and tested whether neutral behavioral states (free movement, gentle restraint, and focal tactile stimulation under gentle restraint) were associated with regions of high metabolic activity in the matrix, in striosomes, or in both. We identified metabolic peaks in the striatum by means of image analysis, striosome-matrix boundaries by [3H]naloxone binding, and primary somatosensory corticostriatal input clusters by injections of anterograde tracer into electrophysiologically identified sites in SI. Peak metabolic activity was primarily confined to the matrix compartment under each behavioral condition. These findings show that during relatively neutral behavioral conditions the balance of activity between the two compartments favors the matrix and suggest that this balance is present in the striatum as part of normal behavior and processing of afferent activity.


Figures

Fig. 1.
Fig. 1.
Computer-based detection of peak glucose utilization rate and striosomes in [14C]DG and [3H]DG autoradiograms of the striatum.A, [14C]2DG autoradiogram of transverse sections through the left striatum of an unstimulated, lightly restrained control rat. The arrow indicates a medial region of relatively high activity. B, Autoradiogram at a similar level from a rat that received tactile stimulation of the hindlimb. Arrows indicate medial (right) and lateral (left) regions of highest metabolic activity estimated by visual inspection. Note that metabolism is heterogeneous in the control as well as the stimulated animal; the effect of stimulation is determined by the location of the peaks that are unique to the stimulated group, in this case the lateral striatum. C, [3H]Naloxone autoradiogram of the same section illustrated in B after washout of the 14C that had been in the tissue, which permitted detection of the [3H]naloxone binding.Arrows indicate two of the μ-opioid receptor-rich striosomes. A′–C′, Digitized and enhanced images of sections shown in A–C. Standard image processing (equalization) shows the darkest regions in the autoradiograms (arrows) as peaks (A′, B′) or striosomes (C′). A"–C", A computerized algorithm detected metabolic peaks (A", B") and striosomes (C"), shown as black features on images of the brain sections. Note that although the original14C-labeled autoradiograms have no sharp feature edges, the algorithm located the largest, darkest, clearly separable features. Thetop left arrow in B" indicates a metabolic peak in the lateral striatum that was absent in the control shown in A". This peak location, found reliably in all stimulated animals, corresponded to a hindlimb sensorimotor cortex input zone. CC, Corpus callosum; EC, external capsule. Scale bar, 500 μm.
Fig. 2.
Fig. 2.
Distribution of metabolic peaks in the striatum in the quiet and free-movement groups and in the restrained control and stimulation groups. Centroids of peaks are shown asdots. The drawings illustrate the 2.5 mm anteroposterior range in which the peak distribution (dots drawn onhorizontal sections) in the comparison groups were statistically different. The far lateral striatum was especially activated by movement and somatosensory stimulation. Color dots indicate the area of lateral peaks not present in restraint controls. A, Quiet group. B, Active group. Peaks appear farther laterally in the striatum in the active than in the quiet animals. The same was true for stimulated versus restraint controls for HL stimulation (C, restraint control; D, stimulated), VIB (E, restraint control; F, stimulated), and FL (G, restraint control; H, stimulated) stimulation groups. ec, External capsule. The template for the horizontal sections is modified from Paxinos and Watson (1998) at interaural 5.26 mm. Scales are in millimeters.
Fig. 3.
Fig. 3.
Metabolic peaks in the striatum of stimulated and free-movement animals overlap minimally with striosomes.A, Surface plot of the dorsolateral striatum in a HL-stimulated animal (shown in Fig. 1B), color-coded to illustrate the peaks and valleys formed by the high and low gray levels that represent glucose utilization rates. The gray level of the yellow–brown peak (white arrow 1) is 20% higher than the gray level of the baseline measured at black arrow 5, which is the mean gray level measured for the entire striatum. The white dotted line indicates the level of the cross-section shown in B. Thewhite arrows indicate the peaks, and the black arrows indicate the valleys that correspond to those shown inB. B, Profile of gray levels plotted along the white dotted line in A. Eachcolor represents four gray levels. The program used for peak detection first detects the darkest pixels (yellow) and then progressively lowers the threshold to include the gray levels shown in the brownsand greens. In this example, when the gray levels in thelight green range are detected, the two largest peaks merge across the valley indicated by black arrow 4. The program then chooses the level of detection that does not merge the two peaks. C, Image of the metabolic peaks detected inA overlaid on the autoradiogram with labeled striosomes. The program detected two peaks in the dorsolateral striatum (arrow), color-coded according to the plot profile and surface plots in A and B. The region of highest metabolism is shown in yellow.Asterisks show examples of striosomes (blue; compare locations in A andC). D, Same image as in C, except that the detection level was set to include gray levels well below those illustrated in C. Accordingly, the program detected larger peaks than those shown in C, which allowed the peaks to merge but still produced very little overlap (white) with striosomes. E, F, Two examples of minimal or no overlap in the free-movement group. Metabolic peaks (green) avoid striosomes (blue) or show overlap (red).G, Three-dimensional rendering of 10 serial sections (30 μm each; 300 μm total) in the anterior striatum illustrating two stimulus-specific metabolic peaks (green) and striosomes (blue). Regions of overlap are shown inred. H, Same 10-section reconstruction rotated forward 75° around the x-axis to illustrate the view from the dorsal surface of the striatum. Thearrows indicate the same small regions of overlap shown in G and H. Reconstructions and three-dimensional renderings were made using VoxBlast software (Vaytek Inc., Fairfield, IA). EC, External capsule. Scale bar, 500 μm.
Fig. 4.
Fig. 4.
Restriction of metabolic peaks to the striatal matrix after tactile stimulation. A, Panels 155–144 (numbers at top right) show digitized images of the right striatum from a single section from an FL stimulation case, subjected to iterative thresholding from gray level 155 to gray level 144. Even when metabolic peak detection was increased to include most of the dorsolateral striatum, the progressively lower rates of glucose utilization included still lay within the matrix. The DG peaks (red) were superimposed on a template of striosomes (blue) detected in the same transverse section by [3H]naloxone binding. Overlap is shown in yellow. The arrows inpanel 151 indicate the peaks associated with FL stimulation according to comparisons with controls. The gray level inpanel 151 was chosen by the algorithm for measurement of peak feature size. B, Plot of the overlap of DG peaks with [3H]naloxone-positive striosomes (solid line) and a hypothetical linear function for overlap (dotted line). The actual overlap is nonlinear at <8% DG detection (A, panels 155–149).C, Panels 2–12 show 11 artificial, randomly distributed sets of DG features superimposed on the same template as in A. The first panelillustrates the actual data. The number of pixels in which DG peaks (red) and striosomes (blue) overlap is shown in the top right. The area of overlap in thefirst panel with actual data (27 pixels) is less than in any of the randomly distributed sets (89–241 pixels; each pixel = 24 μm). D, Comparison of the overlap of striosomes with peaks detected in actual cases (white bars) and with artificial, randomly distributed peaks (black bars). The 21 pairs of bars are data derived from transverse sections through the striatum in 11 rats. For each section, overlap with [3H]naloxone-positive striosomes was measured for 100 sets of actual peaks and for these peaks given randomly generated locations. Bars represent median overlap; overlap of the randomly distributed features was significantly greater (64.3 vs 23.7 pixels; p < 0.0007).
Fig. 5.
Fig. 5.
Anatomically identified matrisomes and neural activity coincide over a wide anteroposterior extent of the sensorimotor striatum. Corticostriatal inputs from the hindlimb region of cortex were labeled with BDA (A1–D1), and 2DG maps of the striatum were made after HL stimulation. Row Aand rows B–D are from two different rats. Eachrow shows a different anteroposterior level, ranging from −0.8 to +1.0 mm relative to bregma. BDA-labeled terminal arborization fields are indicated by arrows.A2–D2, Digitized versions of the BDA-stained sections at a size and resolution comparable with those of the adjacent section 2DG autoradiograms. A3–D3, Metabolic peaks (white) detected in adjacent section 2DG autoradiograms after tactile stimulation of the contralateral hindlimb.A4–D4, Outlines of the metabolic peaks inA3–D3 overlaid on images of the BDA-stained sections, showing good correspondence between the anatomic HL projection field and the largest HL metabolic peaks. A5, Thedashed rectangle indicates the region shown in the preceding panels. B5–D5, Low-power views of sections shown in B1-D1. AC, Anterior commissure; CC, corpus callosum; EC, external capsule; S, septum; STR, striatum. Scale bars, 500 μm.

Similar articles

Cited by

References

    1. Ackermann RF, Finch DM, Babb TL, Engel J., Jr Increased glucose metabolism during long-duration recurrent inhibition of hippocampal pyramidal cells. J Neurosci. 1984;4:251–264. - PMC - PubMed
    1. Alexander GE, Crutcher MD. Functional architecture of basal ganglia circuits: neural substrates of parallel processing. Trends Neurosci. 1990;13:266–272. - PubMed
    1. Alloway KD, Crist J, Mutic JJ, Roy SA. Corticostriatal projections from rat barrel cortex have an anisotropic organization that correlates with vibrissal whisking behavior. J Neurosci. 1999;19:10908–10922. - PMC - PubMed
    1. Aosaki T, Kimura M, Graybiel AM. Temporal and spatial characteristics of tonically active neurons of the primate's striatum. J Neurophysiol. 1995;73:1234–1252. - PubMed
    1. Bejjani B, Damier P, Arnulf I, Thivard L, Bonnet A, Dormont D, Cornu P, Pidoux B, Samson Y, Agid Y. Transient acute depression induced by high-frequency deep-brain stimulation. N Engl J Med. 1999;340:1476–1480. - PubMed

Publication types

LinkOut - more resources