. 2002 Jan 1;22(1):324-37.
doi: 10.1523/JNEUROSCI.22-01-00324.2002.

Cellular mechanisms of infralimbic and prelimbic prefrontal cortical inhibition and dopaminergic modulation of basolateral amygdala neurons in vivo

Affiliations

Cellular mechanisms of infralimbic and prelimbic prefrontal cortical inhibition and dopaminergic modulation of basolateral amygdala neurons in vivo

J Amiel Rosenkranz et al. J Neurosci. .

Abstract

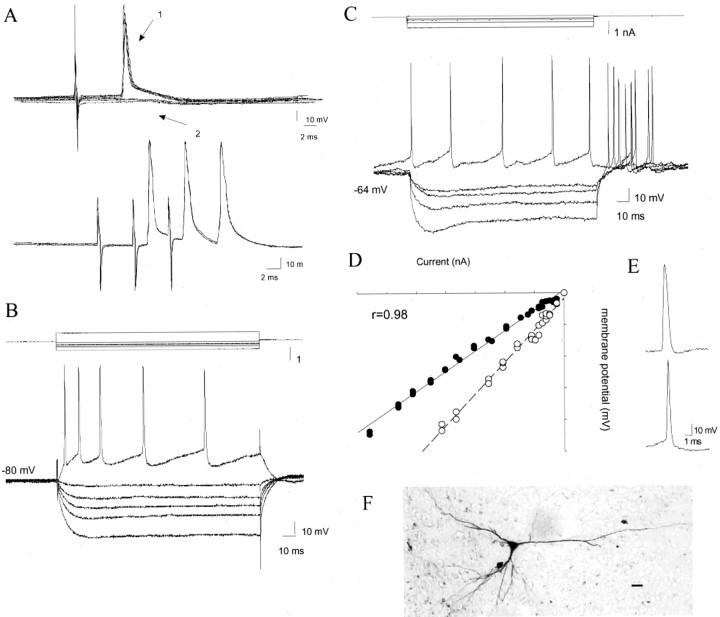
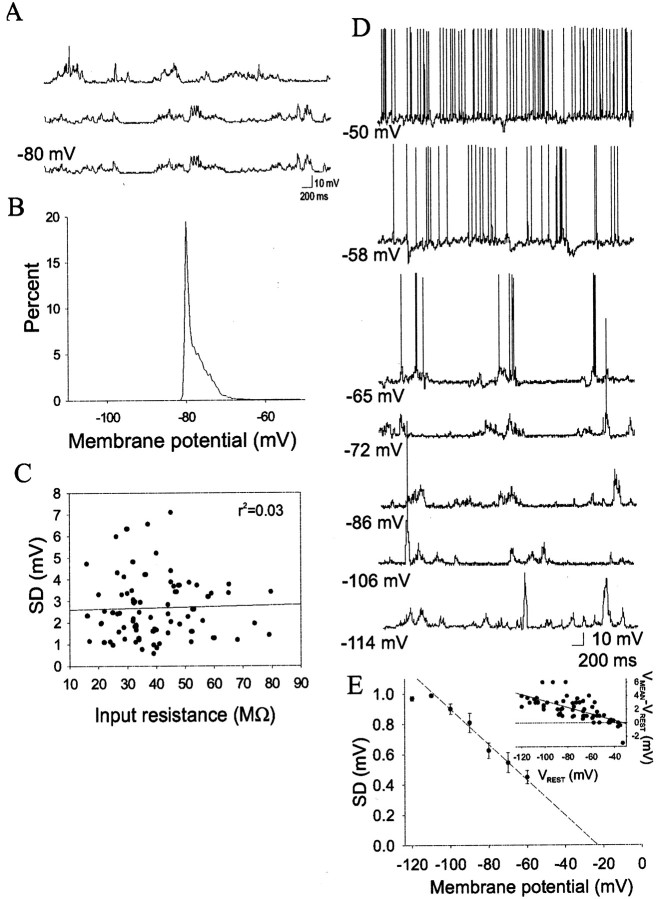
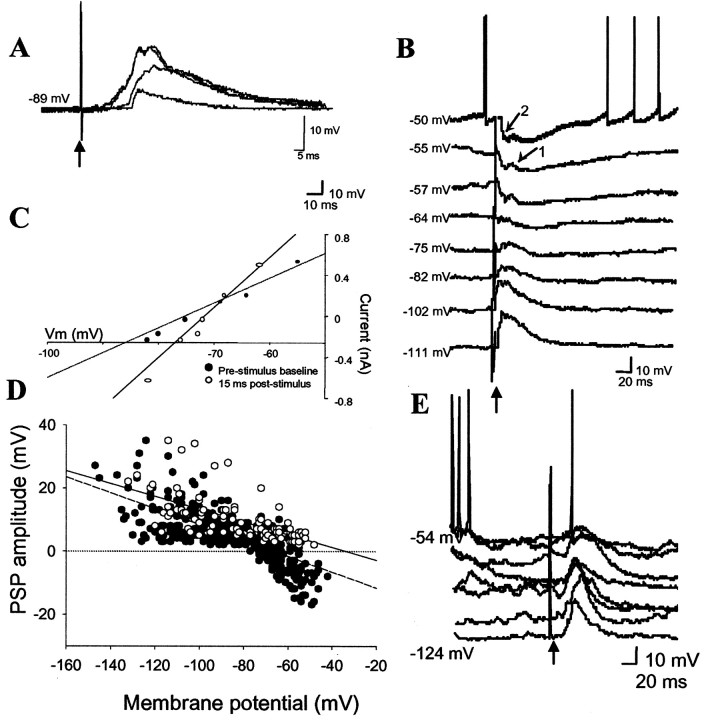
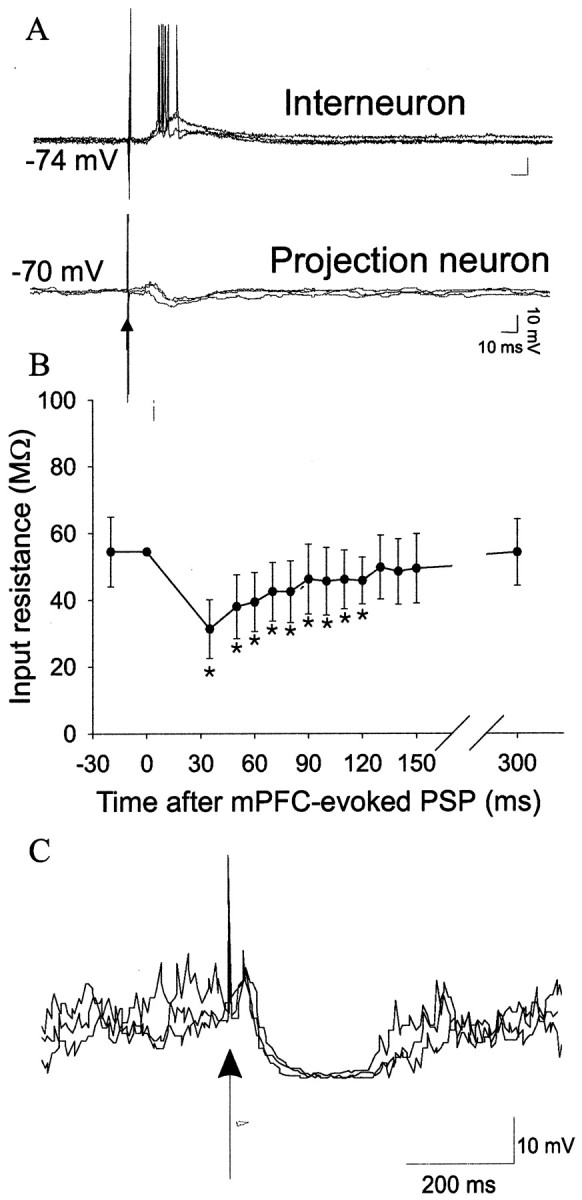
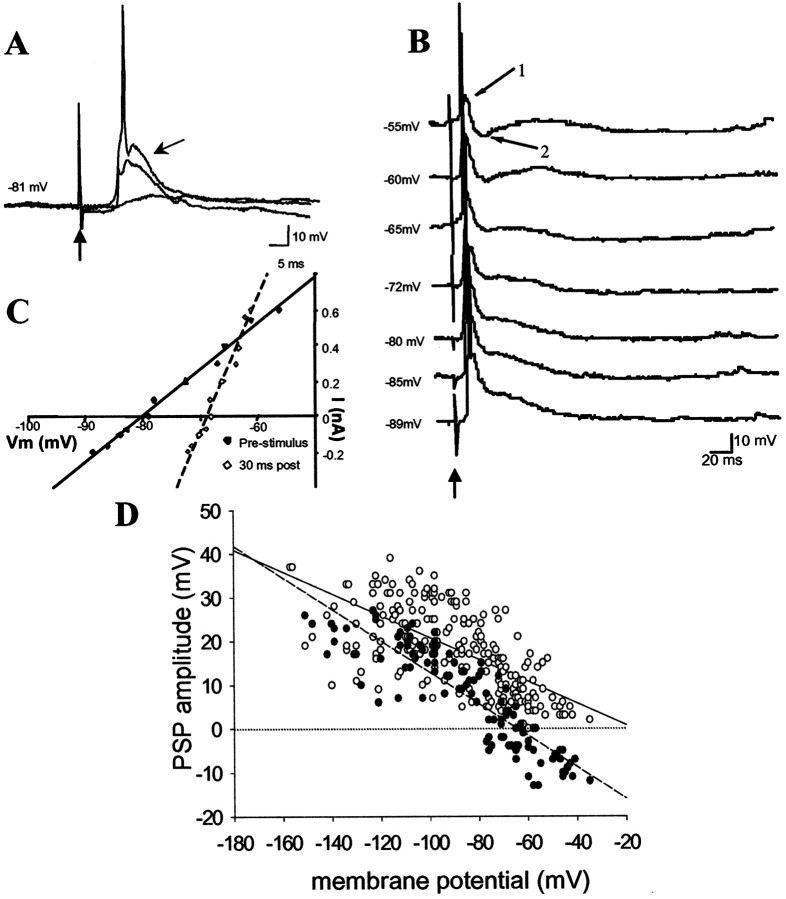
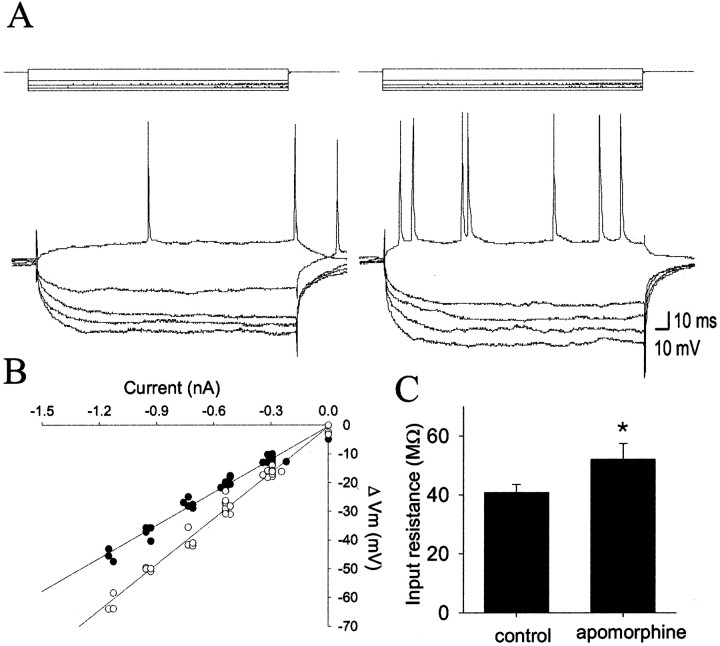
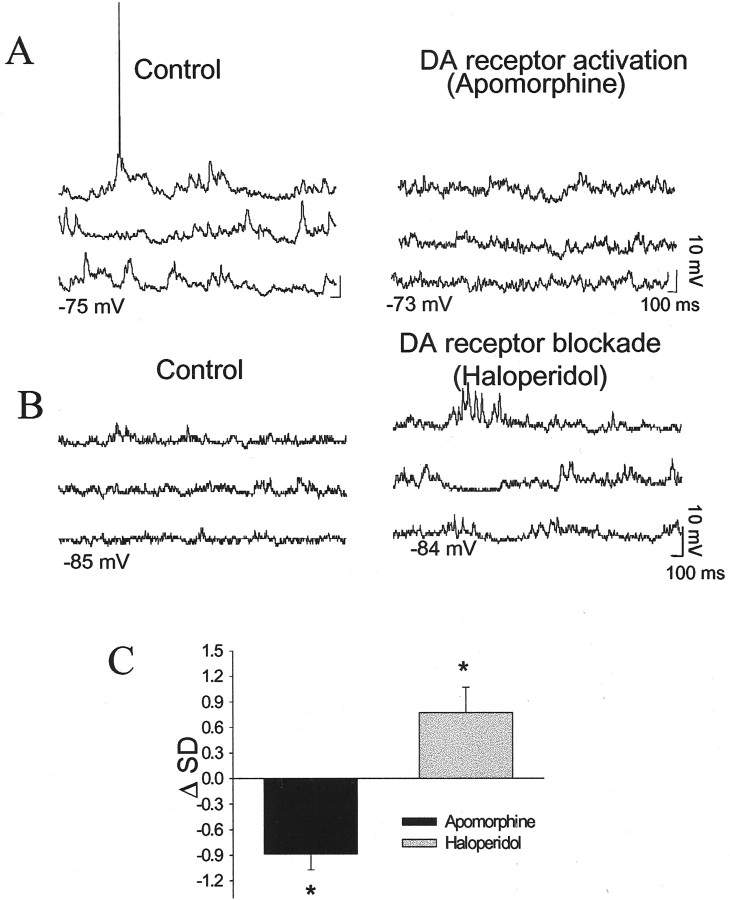
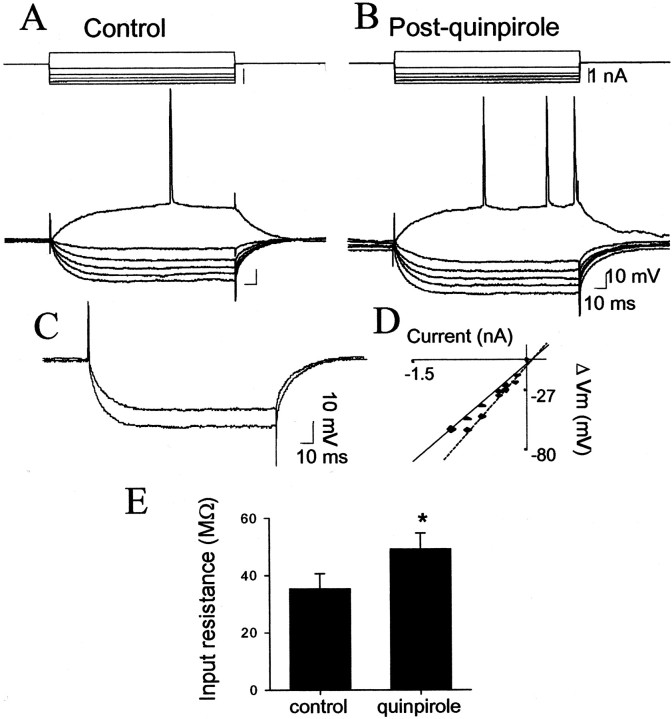
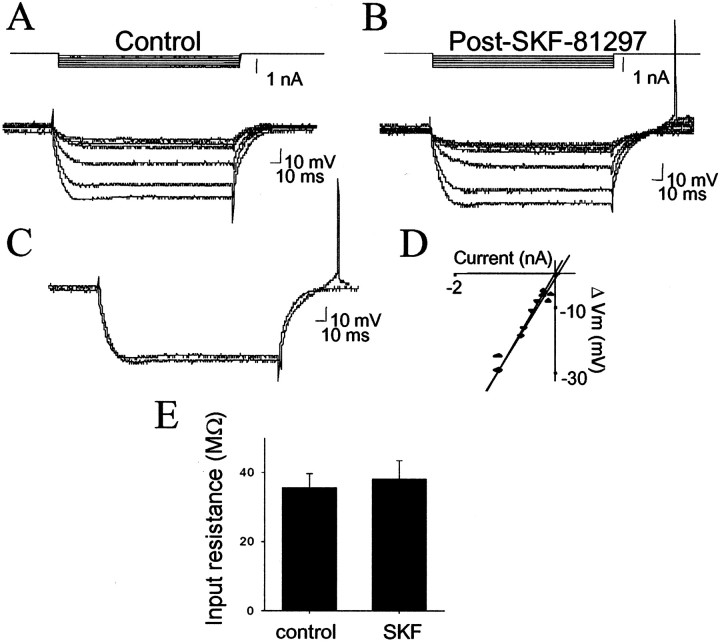
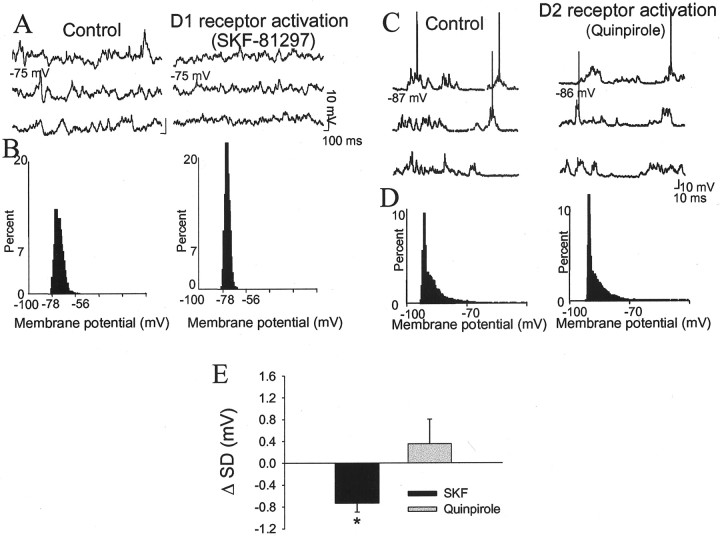
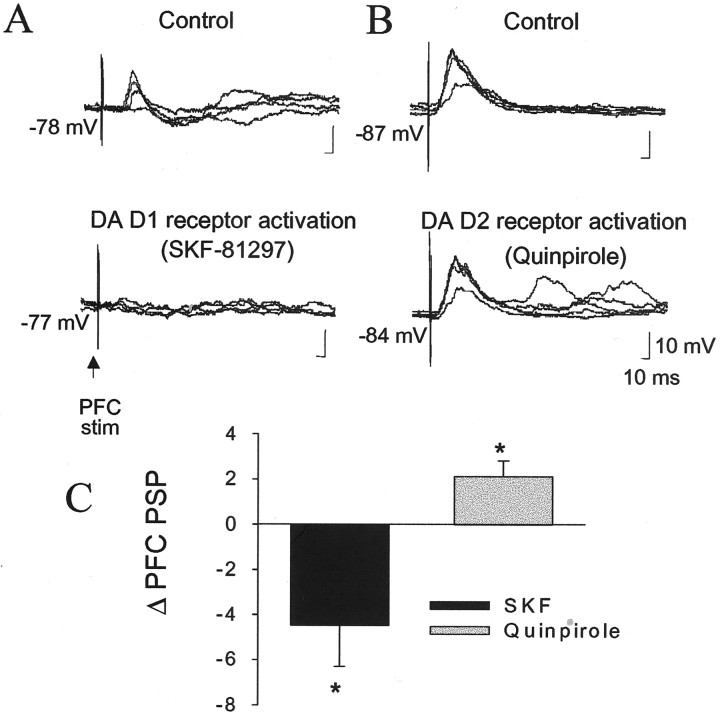
The basolateral amygdala (BLA) is believed to be involved in schizophrenia, depression, and other disorders that display affective components. The neuronal activity of the BLA, and BLA-mediated affective behaviors, are driven by sensory stimuli transmitted in part from sensory association cortical regions. These same behaviors may be regulated by prefrontal cortical (PFC) inputs to the BLA. However, it is unclear how two sets of glutamatergic inputs to the BLA can impose opposing actions on BLA-mediated behaviors; specifically, it is unclear how PFC inputs exert inhibitory actions over BLA projection neurons. Dopamine (DA) receptor activation enhances BLA-mediated behaviors. Although we have demonstrated that DA suppresses medial PFC inputs to the BLA and enhances sensory cortical inputs, the precise cellular mechanisms for its actions are unknown. In this study we use in vivo intracellular recordings to determine the means by which glutamatergic inputs from the PFC inhibit BLA projection neurons, contrast that with glutamatergic inputs from the association sensory cortex (Te3) that drive BLA projection neurons, and examine the effects of DA receptor activation on neuronal excitability, spontaneous postsynaptic potentials (PSPs), and PFC-evoked PSPs. We found that PFC stimulation inhibits BLA projection neurons by three mechanisms: chloride-mediated hyperpolarization, a persistent decrease in neuronal input resistance, and shunting of PSPs; all effects are possibly attributable to recruitment of inhibitory interneurons. DA receptor activation enhanced neuronal input resistance by a postsynaptic mechanism (via DA D2 receptors), suppressed spontaneously occurring and PFC-evoked PSPs (via DA D1 receptors), and enhanced Te3-evoked PSPs.


Figures

Fig. 1.
Fig. 1.
BLA projection neurons. Projection neurons of the BLA can be identified by antidromic activation (A), demonstrated by constant response latency (top, arrow 1) in the absence of a PSP (top, arrow 2), and by the ability to follow high-frequency stimulation (A,bottom). The excitability of these neurons can be estimated by membrane deflections in response to intracellular current injection (B, projection neuron; C, interneuron), yielding a measurement of input resistance (D, black circles, projection neurons, 32 MΩ; white circles, interneurons, 46 MΩ). Also note that projection neurons display spike accommodation, whereas interneurons of the BLA do not (B, C), and interneurons exhibit shorter duration action potentials (E, bottom trace) when compared with projection neurons (E, top trace). Neurons identified post hoc had morphologies consistent with projection neurons (F); Scale bar, 20 μm.
Fig. 2.
Fig. 2.
Spontaneous activity of BLA projection neurons. BLA neurons display spontaneous membrane deflections (A) that can be estimated by the SD of the membrane potential (SD is 2.8 mV in this case); this SD can be demonstrated by a histogram of the time spent at a given membrane potential (B). The fluctuations are not systematically associated with input resistance (C), but the amplitude is dependent on the membrane potential (D) (also note the reversal of many PSPs near −65 mV, as demonstrated by hyperpolarizing PSPs), as indicated by a plot of normalized SD as a function of membrane potential (E) (group data, n= 14). This indicates that the fluctuations are likely to reflect spontaneous inputs. The inset in E plots the difference between the mean membrane potential and the resting membrane potential in several neurons (n = 14) as a function of membrane potential. Voltages listed beside intracellular traces are the resting membrane potentials.
Fig. 3.
Fig. 3.
Response to mPFC stimulation.A, The PSP amplitudes evoked by mPFC stimulation are stimulus intensity-dependent. (Voltage traces of responses to 0.1, 0.4, and 0.7 mA of stimulation are displayed.) Intracellular voltage traces indicate that mPFC stimulation evokes PSPs that reverse close to the chloride reversal potential (B, arrow 2) and sometimes PSPs that are extrapolated to reverse near −30 mV (B, arrow 1).C, The reversal potential of the primary PSP evoked in the neuron in B, demonstrated by the intersection of baseline membrane potential (filled circles) and PSP amplitude (open circles) in a plot of PSP amplitude as a function of membrane potential, is −67 mV. The grouped data (n = 39) plot of the PSP amplitude by membrane potential (D) for the EPSPs (white circles) and the IPSPs (black circles) demonstrates that the IPSPs reverse near the chloride reversal potential (dashed line), whereas the EPSPs are extrapolated to reverse near −20 mV (solid line). In contrast, mPFC-evoked responses in striatal neurons do not reverse near the chloride reversal potential (E). Upward arrows indicate mPFC stimulation.
Fig. 4.
Fig. 4.
Inhibition evoked by mPFC stimulation. mPFC stimulation evokes a depolarizing potential and spikes in interneurons (A, top) as well as hyperpolarization in projection neurons (A, bottom). In addition to the hyperpolarization, mPFC stimulation produces a prolonged decrease in neuronal input resistance (B) and shunts spontaneous PSPs (C), as reflected by the lack of spontaneous PSPs after mPFC stimulation. Upward arrows indicate mPFC stimulation. *Significant difference from baseline; p < 0.05; paired t test.
Fig. 5.
Fig. 5.
Excitatory response to Te3 stimulation.A, Te3 stimulation evokes an intensity-dependent PSP. (Voltage traces of responses to 0.1, 0.4, and 0.7 mA of stimulation are displayed.) This PSP is composed of a component that depolarizes at all membrane potentials tested (B,arrow 1) and a component that appears to reverse near the chloride reversal potential (B, arrow 2). In this neuron, the second component reverses at −65 mV, as determined by the intersection of the membrane potential (C, dashed line, time point 2 inB) and the IPSP amplitude in response to hyperpolarizing pulses of current (C, solid line, time point 1 in B). D, In grouped data (n = 18 neurons), it can be demonstrated that the IPSPs evoked by Te3 stimulation (black circles) reverse near −65 mV (dashed line), whereas the evoked EPSPs (white circles) reverse near −20 mV (solid line) in a plot of PSP amplitude as a function of membrane potential. Upward arrows indicate Te3 stimulation in all traces.
Fig. 6.
Fig. 6.
DA receptor activation enhances neuronal excitability. Apomorphine (1.2 mg/kg, i.v.) increases measured voltage deflections in response to pulses of current injection (A, left, before apomorphine) resulting in enhanced input resistance and depolarization-evoked spike discharge (A, right, after apomorphine). This was reflected as an increase in input resistance (B) (before apomorphine, solid circles,Rin = 38 MΩ; after apomorphine,open circles, Rin = 47 MΩ).C, In all neurons tested, apomorphine administration increased neuronal input resistance; *p < 0.05.
Fig. 7.
Fig. 7.
DAergic effects on spontaneous PSPs. DA receptor activation (apomorphine, 1.2 mg/kg, i.v.) suppresses spontaneous PSPs (A, before apomorphine, 3.1 mV, after apomorphine, 1.7 mV, measured as SD of membrane potential), whereas DA receptor blockade (haloperidol, 0.8 mg/kg, i.v.) enhances spontaneous PSPs (B, before haloperidol, 1.6 mV, after haloperidol, 2.3 mV). C, Apomorphine consistently reduced spontaneous PSPs (six of seven neurons), whereas haloperidol consistently enhanced spontaneous PSPs (six of seven neurons); *p < 0.05.
Fig. 8.
Fig. 8.
DA D2 receptor activation enhances neuronal excitability. Administration of the DA D2 agonist quinpirole (0.6 mg/kg, i.v.) enhanced membrane deflections in response to intracellular current injection (A, before quinpirole, 58 MΩ; B, after quinpirole, 71 MΩ). This is demonstrated by overlaying voltage traces in response to 1 nA of current injection before and after quinpirole (C) showing an enhanced response after quinpirole, as well as by a plot of input resistance (D; dashed lineafter quinpirole). E, Quinpirole consistently increased neuronal input resistance (six of seven neurons); *p < 0.05.
Fig. 9.
Fig. 9.
DA D1 receptor activation does not enhance neuronal excitability. Administration of the DA D1 agonist SKF-81297 (6 mg/kg, i.v.) did not alter neuronal responses to current injection (A, before SKF-81297, 28 MΩ;B, after SKF-81297, 26 MΩ). Responses to 1.0 nA of current injection (C) as well as input resistance plots (D) overlay closely. E, Administration of the DA D1 agonists SKF-81297 or SKF-38393 did not have a significant effect on neuronal input resistance.
Fig. 10.
Fig. 10.
DA D1 receptor activation but not D2 stimulation suppresses spontaneous PSPs. Administration of the DA D1 agonist SKF-81297 (6 mg/kg, i.v.) suppresses spontaneous PSPs (A), as demonstrated by decreased fluctuation of the membrane potential in a histogram of percentage of time spent at a given membrane potential (B, SD of membrane potential before SKF-81297, 1.8 mV; SD of membrane potential after SKF-81297, 0.6 mV). Administration of the DA D2 agonist quinpirole (1.2 mg/kg, i.v.) did not suppress spontaneous PSPs (C), nor did it alter the distribution of membrane potential over time (D, SD before quinpirole, 3.4 mV; SD after quinpirole, 3.3 mV). E, Whereas administration of the DA D1 agonists attenuated spontaneous PSPs (seven of seven neurons), the DA D2 agonist quinpirole had no significant effect; *p < 0.05.
Fig. 11.
Fig. 11.
DA D1 receptor activation but not D2 stimulation suppresses mPFC-evoked PSPs. Administration of the DA D1 agonist SKF-81297 (6 mg/kg, i.v.) suppressed mPFC-evoked PSPs (A, before SKF-81297, 11 mV; after SKF-81297, 0 mV). Administration of the DA D2 agonist quinpirole (0.6 mg/kg, i.v.) slightly enhanced mPFC-evoked responses (B, before quinpirole, 12 mV; after quinpirole, 14 mV). C, The DA D1 agonists consistently suppressed mPFC-evoked responses (six of six neurons), whereas the DA D2 agonist consistently enhanced mPFC-evoked responses (four of four neurons); *p < 0.05.

Similar articles

Cited by

References

    1. Alheid G, de Olmos JS, Beltramino CA. Amygdala and extended amygdala. In: Paxinos G, editor. The rat nervous system, Ed 2. Academic; Sydney: 1995. pp. 495–572.
    1. Al Maskati HA, Zbrozyna AW. Stimulation in prefrontal cortex area inhibits cardiovascular and motor components of the defense reaction in rats. J Auton Nerv Syst. 1989;28:117–126. - PubMed
    1. Anderson JS, Carandini M, Ferster D. Orientation tuning of input conductance, excitation, and inhibition in cat primary visual cortex. J Neurophysiol. 2000;84:909–926. - PubMed
    1. Anderson JS, Lampl I, Gillespie DC, Ferster D. Membrane potential and conductance changes underlying length tuning of cells in cat primary visual cortex. J Neurosci. 2001;21:2104–2112. - PMC - PubMed
    1. Angrist BM, Gershon S. The phenomenology of experimentally induced amphetamine psychosis: preliminary observations. Biol Psychiatry. 1970;2:95–107. - PubMed

Publication types

MeSH terms

LinkOut - more resources