Comparative Study
. 2002 Jan;22(2):442-52.
doi: 10.1128/MCB.22.2.442-452.2002.

Replication initiation patterns in the beta-globin loci of totipotent and differentiated murine cells: evidence for multiple initiation regions

Affiliations
Comparative Study

Replication initiation patterns in the beta-globin loci of totipotent and differentiated murine cells: evidence for multiple initiation regions

Mirit I Aladjem et al. Mol Cell Biol. 2002 Jan.

Abstract

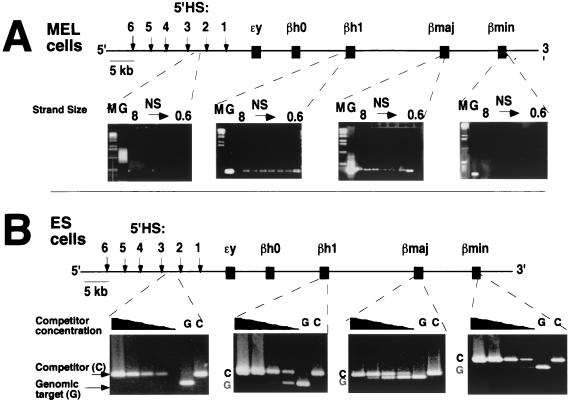
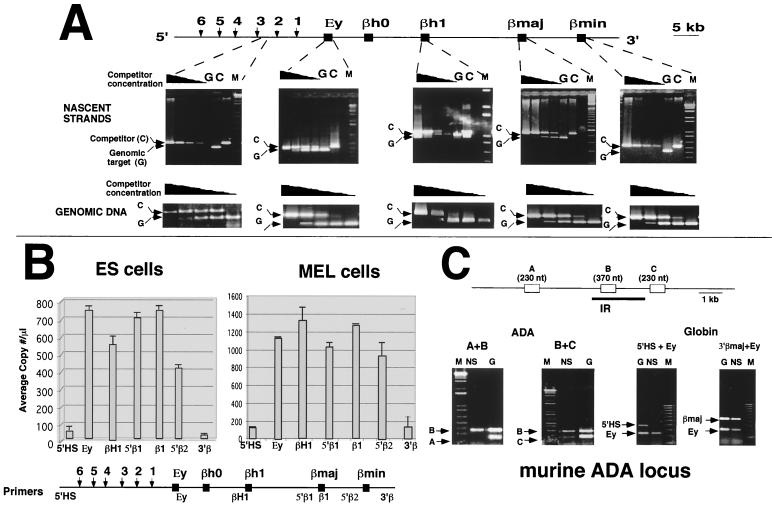
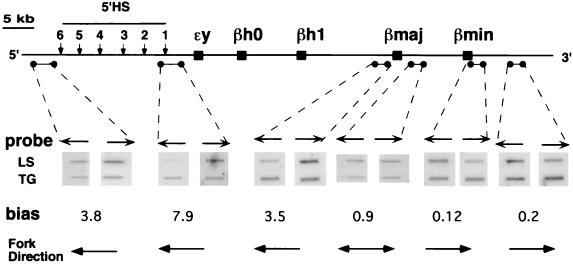
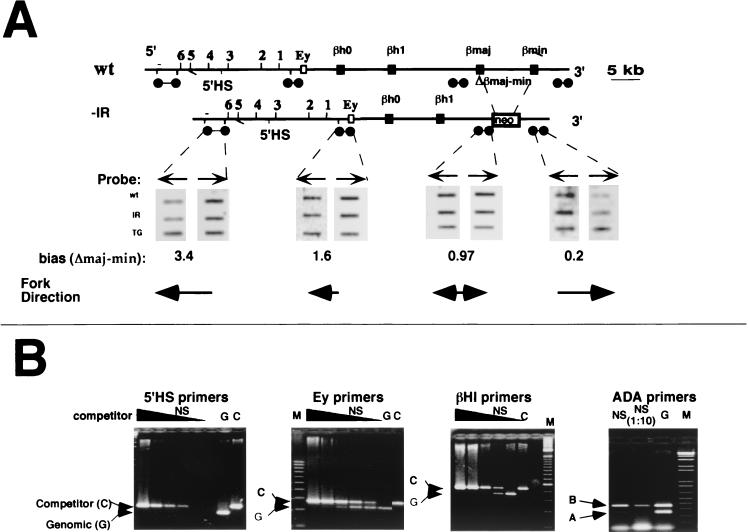
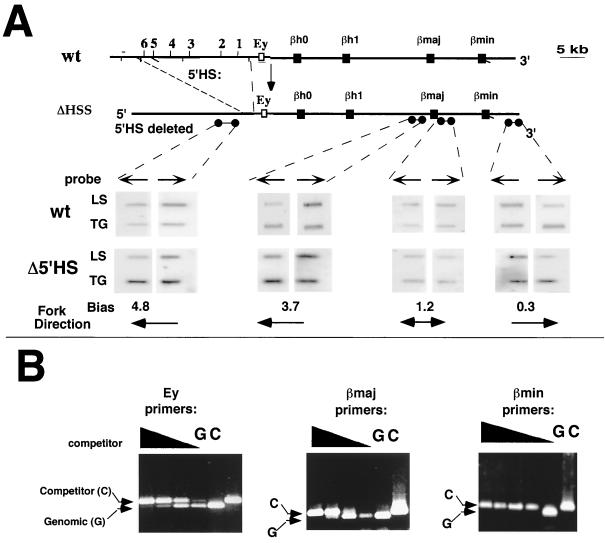
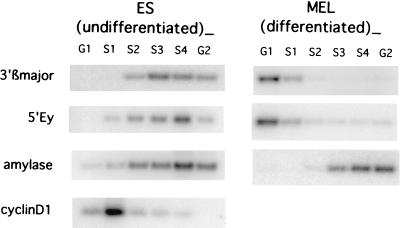
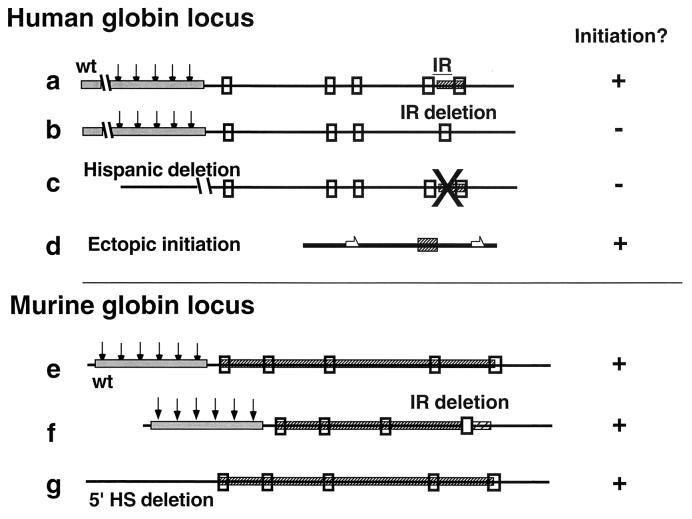
The replication initiation pattern of the murine beta-globin locus was analyzed in totipotent embryonic stem cells and in differentiated cell lines. Initiation events in the murine beta-globin locus were detected in a region extending from the embryonic Ey gene to the adult betaminor gene, unlike the restricted initiation observed in the human locus. Totipotent and differentiated cells exhibited similar initiation patterns. Deletion of the region between the adult globin genes did not prevent initiation in the remainder of the locus, suggesting that the potential to initiate DNA replication was not contained exclusively within the primary sequence of the deleted region. In addition, a deletion encompassing the six identified 5' hypersensitive sites in the mouse locus control region had no effect on initiation from within the locus. As this deletion also did not affect the chromatin structure of the locus, we propose that the sequences determining both chromatin structure and replication initiation lie outside the hypersensitive sites removed by the deletion.


Figures

FIG. 1.
FIG. 1.
Analysis of BrdU-labeled-nascent-strand abundance within the murine β-globin locus. The abundance of origin-specific DNA sequences in BrdU substitution-containing nascent strands from differentiated and totipotent cells was determined. (A) Nascent strands derived from MEL cells, a differentiated cell line in the hematopoietic lineage, were size fractionated on an agarose gel. Each size fraction was used as a template for amplification with the 5′HS, βh1, βmajor, and βminor primers (see Materials and Methods for sequences). PCR with the βh1 and βmajor primers yielded products from both large and small nascent strands, indicating that these primers are near sites of replication initiation. In contrast, primers within 5′HS and βminor failed to yield products from small nascent strands, as expected if they are not near an IR. (B) Nascent strands from totipotent ES cells. Nascent strands were isolated from gel fractions containing fragments ranging from 0.8 to 1.5 kb. These strands were amplified with the 5′HS, βh1, βmajor, and βminor primers in the presence of variable quantities of competitor templates (1, 0.1, 0.01, and 0.001 pg per reaction, from left to right in each panel) to control for variations in amplification efficiency. PCR primers from the βh1 and βmajor regions amplified products from small nascent strands, whereas primers from the 5′HS and the βminor regions did not, indicating that initiation in ES cells occurred in the region similar to the IR in MEL cells. M, molecular weight markers; G, total genomic DNA; C, competitor; NS, nascent strands.
FIG. 2.
FIG. 2.
Analysis of exonuclease-resistant-nascent-strand abundance within the murine β-globin locus. The abundance of origin-specific DNA sequences in λ-exonuclease-resistant nascent strands from ES cells was determined by PCR. (A) DNA strands isolated from a gel fraction containing strands ranging from 1 to 1.8 kb were amplified with the primer pairs 5′HS, Ey, βh1, βmajor, and βminor (see Materials and Methods for primer locations and sequences). Amplification reactions were performed in the presence of a series of 10-fold dilutions of PCR competitors as outlined in the legend to Fig. 1B. Ey, βh1, and βmajor primer pairs could amplify products from nascent strands, while 5′HS and βminor primers could not. All primers amplified product from genomic DNA (lower panels). (B) Short, λ-exonuclease-resistant, newly replicated DNA strands were prepared as described above and amplified by real-time quantitative PCR using the indicated primer pairs. Detection of amplification with the 5′HS, 5′β1, β1, 5′β2, and 3′β primers sets was based on FAM fluorescence using FRET-based probing (ABI TaqMan chemistry). Detection of amplification with the Ey and βh1 primers was based on SYBR Green fluorescence followed by gel electrophoresis to verify single-fragment amplification. Data are averages from four measurements for each primer pair from a single preparation of nascent strands. Similar results were obtained from two independent preparations of λ-exonuclease-resistant nascent strands for each cell line. (C) Verification of nascent-strand selectivity by examination of nascent strands abundance in the previously characterized murine ADA locus. λ-exonuclease-resistant DNA strands ranging from 0.6 to 8 kb from the preparation used for panel A were amplified with primer pairs A, B, and C from the murine ADA locus (36). Duplex PCR was performed either with pairs A and B or with pairs B and C. The origin-proximal sequences from the ADA locus (primer pair B) were preferentially amplified, demonstrating that the nascent-strand preparation was enriched for origin-proximal sequences. Although the original analysis (36) suggested that primer pair C is closer to the origin that primer pair B, both primers were able to amplify nascent strands from the smallest fraction used in this analysis at equal frequencies. M, molecular weight markers; G, total genomic DNA; C, competitor; NS, nascent strands.
FIG. 3.
FIG. 3.
Replication fork direction within the murine β-globin locus. Replication fork direction was determined by leading-strand analysis as described previously (3). BrdU substitution-containing leading strands were isolated from emetine-treated ES cells. Hybridization of these strands with single-stranded probes, normalized against the hybridization of total genomic DNA to the same probes, yielded a bias which indicated the direction of replication forks at a specific site through the murine globin locus. Hybridization with 5′HS, 5′Ey, and 5′βmajor probes, located 5′ to the βmajor gene, showed a strong bias towards strands traveling towards the 5′ end of the locus. Hybridization to 3′βminor and 3′HS probes, located upstream of the βminor gene, showed a strong bias towards strands traveling towards the 3′ end of the locus. Hybridization with the 3′βmajor probe, located in the interval between the two adult genes, exhibited no reproducible hybridization bias (biases between 0.8 and 1.2 are considered insignificant; see Materials and Methods for calculation). These results were confirmed with additional probes and leading-strand preparations. Arrows above the panels show the direction of the probes used in the analyses, while arrows below the panels show the direction of leading-strand progression. Preferential hybridization of a probe to leading strands suggests that the majority of the leading strands are complementary to the probe. LS, leading strands; TG, total genomic DNA.
FIG. 4.
FIG. 4.
Initiation of DNA replication in the absence of the region between the two adult genes. The replication pattern in the β-globin locus was analyzed in an ES cell line homozygous for a deletion of the region encompassing the adult globin genes. These cells harbor an active neomycin resistance gene replacing the deleted region. (A) Leading-strand analysis, as outlined in the legend to Fig. 3, showed that replication forks far 5′ to the deleted region traveled towards the 5′ end of the locus, while replication forks 3′ to the βminor gene traveled towards the 3′ end of the locus. We did not observe a significant hybridization bias in the 5′ region proximal to the deletion (5′ to the deleted βmajor gene). Probes used were identical to the probes used in Fig. 3 except for the omission of probes 3′βmajor and 3′βminor, which hybridize with sequences deleted in the cell line lacking βmajor and βminor. The hybridization biases and fork directions for the IR deletion-containing locus are indicated below the panels. The biases obtained for the wild-type locus in the panels were (5′ to 3′) 3.7, 2.4, and 0.17. WT, leading strands from wild-type ES cells; −IR, leading strands from ES cells carrying the deletion; TG, total genomic DNA from ES cells carrying the deletion. (B) Nascent-strand abundance analysis in λ-exonuclease-resistant nascent strands from an ES line lacking βmajor and βminor. The relative abundance of the globin sequences in nascent strands was measured by performing the amplification reaction in the presence of a series of 10-fold dilutions of competitor DNA as outlined in the legend to Fig. 1B. Primers from the Ey and βh1 regions amplified DNA sequences from λ-exonuclease-resistant DNA strands, suggesting that DNA replication initiated in this region, while primers from the 5′HS region did not. As a control for the selectivity of the isolation procedure, we verified that origin-proximal primers from the murine ADA region were preferentially amplified from the λ-exonuclease-resistant-nascent-strand preparation, as outlined in the legend to Fig. 2B. Similar results were obtained with other nascent-strand preparations and additional primers and with BrdU substitution-containing nascent strands (not shown). M, molecular weight markers; NS, nascent strands; G, genomic DNA; C, competitor only.
FIG. 5.
FIG. 5.
Initiation of DNA replication in the absence of the 5′HSs. The replication pattern in the β-globin locus was analyzed in an ES cell strain that harbors a deletion of all the six hypersensitive sites located 5′ to the Ey gene (ΔHSS) (14). (A) Leading-strand analysis, as outlined in the legend to Fig. 3. Probes used were 5′HS, 5′βmajor, 3′βmajor, and 3′HS. Replication forks 5′ to the βmajor gene travel towards the 5′ end of the locus, while replication forks 3′ to the βminor gene travel towards the 3′ end of the locus. We did not observe a significant hybridization bias in the region between the two adult genes. The bias ratios were similar in wild-type and 5′HS deletion chromosomes. (B) Analysis of nascent-strand abundance in the 5′HS deletion-containing cells. The relative abundance of the globin sequences in nascent strands was measured by performing the amplification reaction in the presence of a series of 10-fold dilutions of competitor DNA as outlined in the legend to Fig. 1B. Primers from the Ey, βmajor, and βminor regions were used to amplify DNA sequences from λ-exonuclease-resistant DNA strands ranging from 1 to 1.8 kb. Primers from the Ey and βmajor regions amplified products in the nascent-strand preparations, while primers from the βminor region did not. Similar results were obtained with real-time quantitative PCR, with other primers throughout the locus, and with BrdU substitution-containing nascent strands (not shown), suggesting that the deletion of the 5′HSs did not alter the initiation pattern within the murine β-globin locus. G, genomic DNA control; C, competitor only.
FIG. 6.
FIG. 6.
Timing of β-globin locus DNA replication in undifferentiated (ES) and erythroid (MEL) cells. For each cell line, cells were labeled with BrdU for 90 min and then fractionated with a fluorescence-activated cell sorter to cell cycle compartments corresponding to G1, S1 to S4, and G2 (the G1 and G2 fractions contained some early and late S-phase cells, respectively). BrdU substitution-containing DNA from the cell cycle fractions was isolated by immunoprecipitations as described previously (21). PCR primers corresponding to globin, cyclin D1, and amylase genes were used to amplify specific sequences in the BrdU substitution-containing DNA preparation. Cyclin D1 and amylase were used as early- and late-replicating controls, respectively. In ES cells, sequences within the β-globin locus (3′β major and 5′Ey) replicate late in the cell cycle, at roughly the same time as the late-replicating amylase locus and much later than the early-replicating cyclin D1 locus. In contrast, the β-globin locus in MEL cells displays early replication timing relative to the late-replicating amylase locus.
FIG. 7.
FIG. 7.
Comparison of the replication features in murine versus human β-globin loci. In the human locus, replication from unaltered loci (a) initiates at the IR (hatched box), located between the two adult globin genes (genes are depicted as small empty boxes). A deletion of the IR (b) shows no initiation within the locus. The dependence of initiation on 5′ sequences (gray box) is manifested in the Hispanic thalassemia chromosome (c), where the presence of the IR is not sufficient to direct initiation in the absence of the LCR. The IR fulfills the genetic requirements for a replicator because it is capable of directing initiation at ectopic loci (d). In the murine locus, replication initiates from an extended origin or from multiple initiation points within an extended region (e). Deletion of the sequences between the two adult genes does not abolish initiation in the locus (f), and the initiation pattern does not change when the 5′HS region is deleted (g).

Similar articles

Cited by

References

    1. Aladjem, M., L.-W. Rodewald, J. L. Kolman, and G. M. Wahl. 1998. Genetic dissection of a mammalian replicator in the human beta-globin locus. Science 281:1005–1009. - PubMed
    1. Aladjem, M., and G. M. Wahl. 1997. Mapping replication origins by leading strand analysis in the absence of protein synthesis. Methods Companion Methods Enzymol. 13:281–292. - PubMed
    1. Aladjem, M. I., M. Groudine, L. L. Brody, E. S. Dieken, R. E. K. Fournier, G. M. Wahl, and E. M. Epner. 1995. Participation of the human beta globin locus control region in initiation of DNA replication. Science 270:815–819. - PubMed
    1. Aladjem, M. I., B. T. Spike, L. W. Rodewald, T. J. Hope, M. Klemm, R. Jaenisch, and G. M. Wahl. 1998. ES cells do not activate p53-dependent stress responses and undergo p53-independent apoptosis in response to DNA damage. Curr. Biol. 8:145–155. - PubMed
    1. Bielinsky, A. K., and S. A. Gerbi. 1998. Discrete start sites for DNA synthesis in the yeast ARS1 origin. Science 279:95–98. - PubMed

Publication types