. 2002 Jan;22(2):480-91.
doi: 10.1128/MCB.22.2.480-491.2002.

Cooperativity between DNA methyltransferases in the maintenance methylation of repetitive elements

Affiliations

Cooperativity between DNA methyltransferases in the maintenance methylation of repetitive elements

Gangning Liang et al. Mol Cell Biol. 2002 Jan.

Abstract

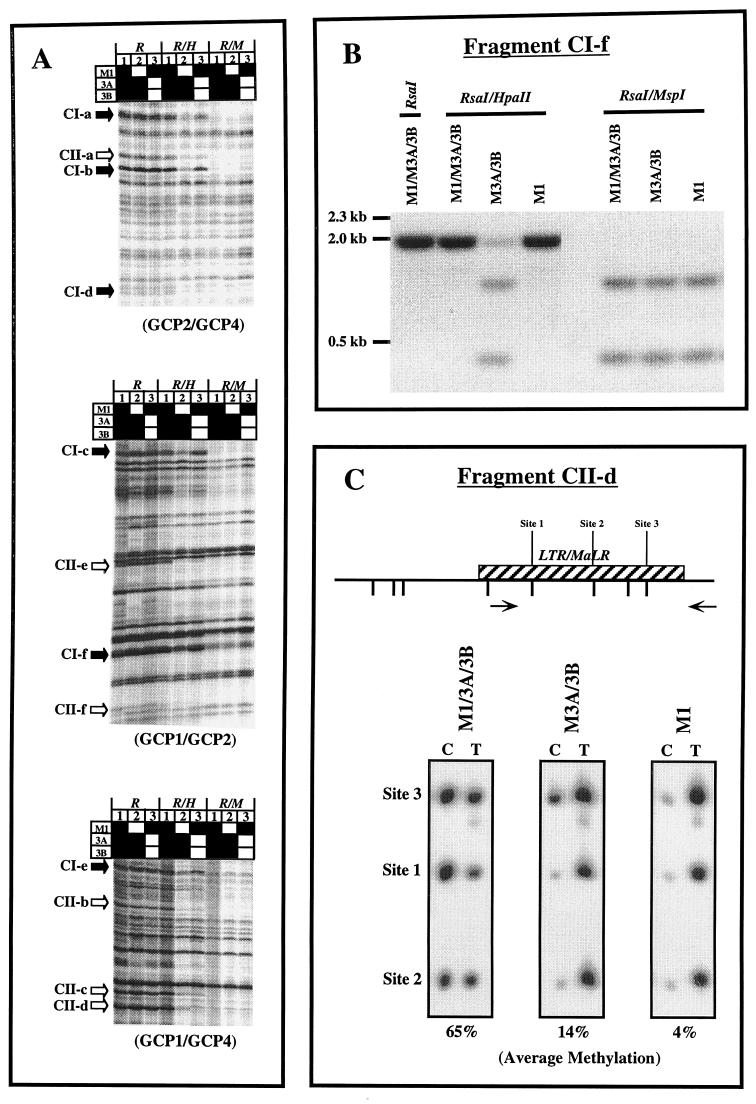
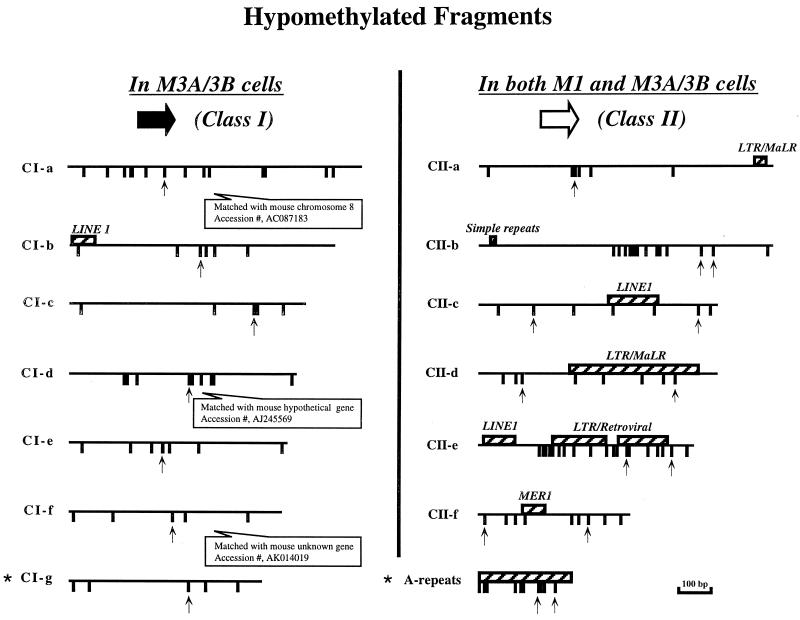
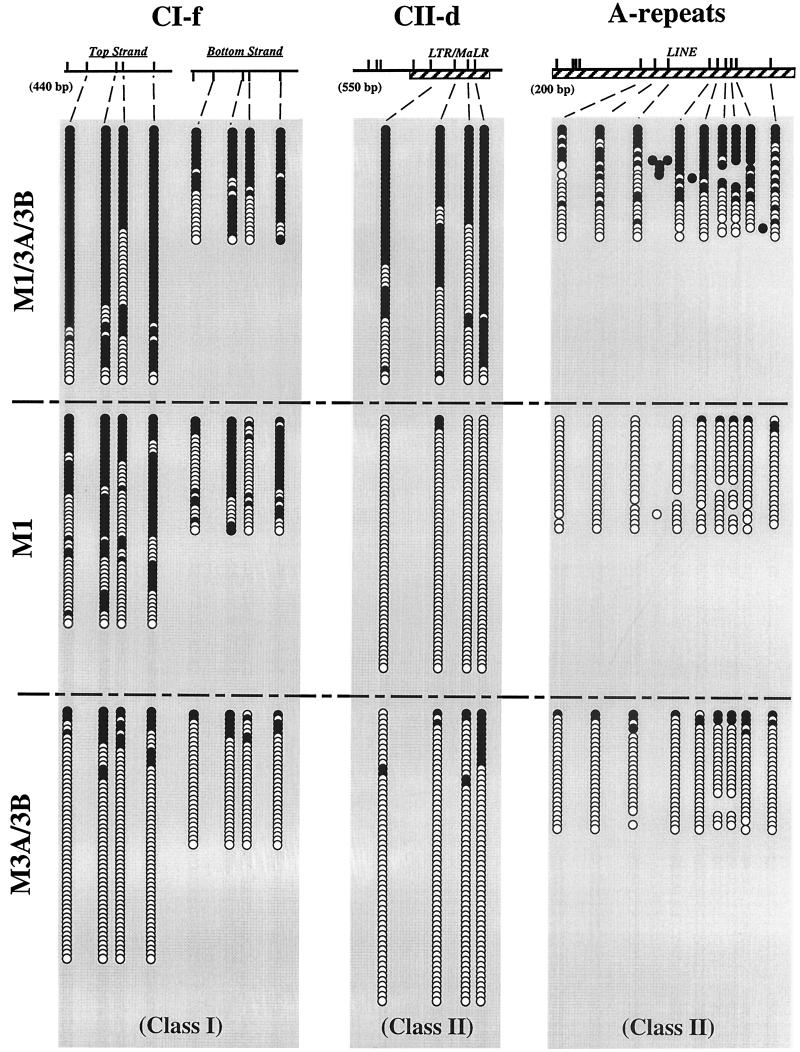
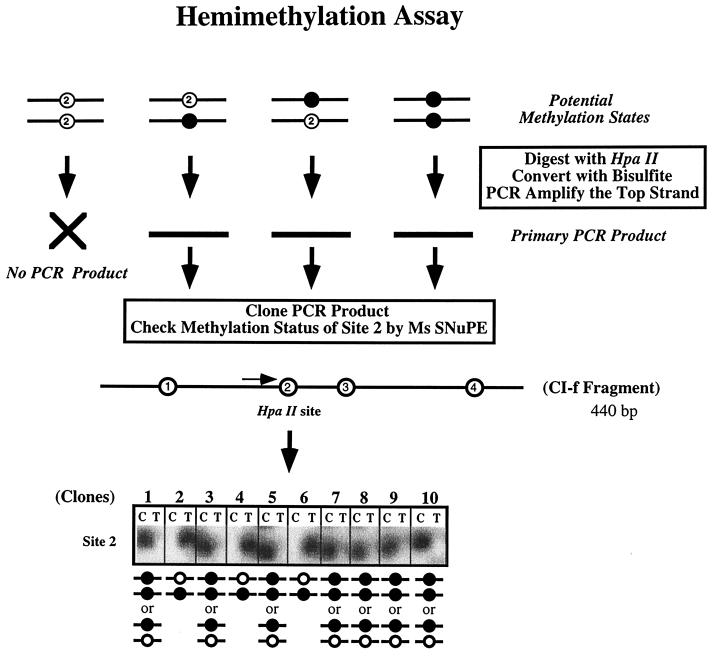
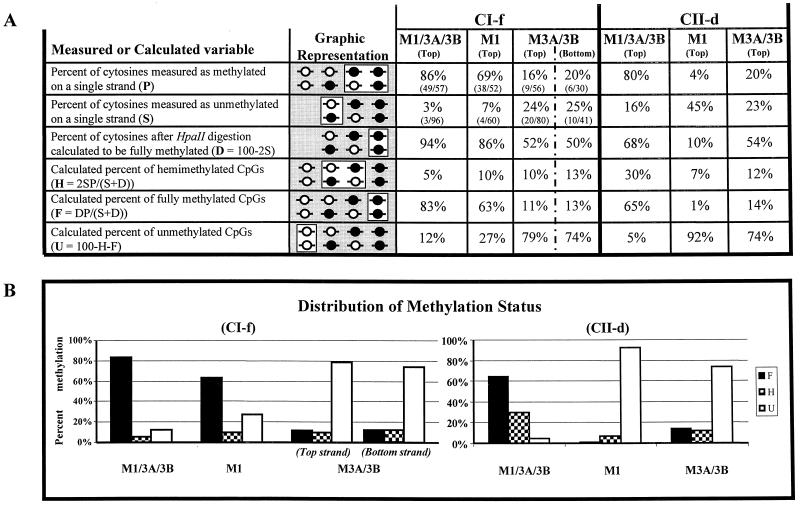
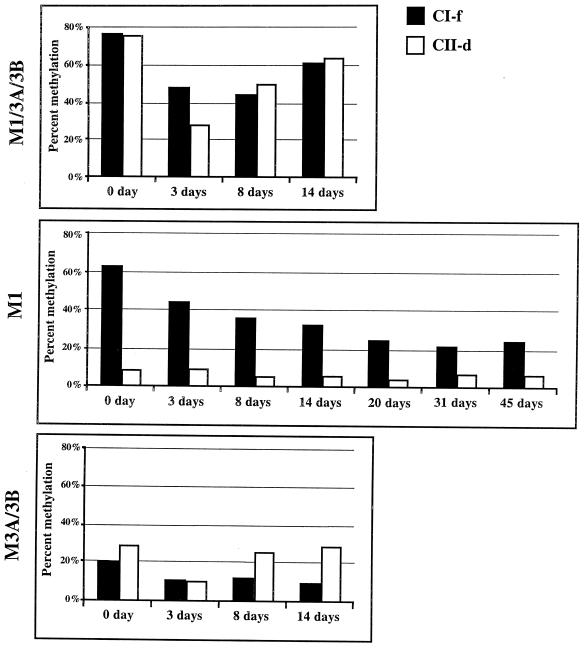
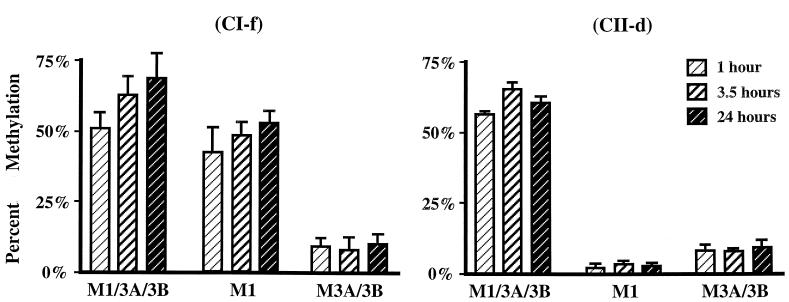
We used mouse embryonic stem (ES) cells with systematic gene knockouts for DNA methyltransferases to delineate the roles of DNA methyltransferase 1 (Dnmt1) and Dnmt3a and -3b in maintaining methylation patterns in the mouse genome. Dnmt1 alone was able to maintain methylation of most CpG-poor regions analyzed. In contrast, both Dnmt1 and Dnmt3a and/or Dnmt3b were required for methylation of a select class of sequences which included abundant murine LINE-1 promoters. We used a novel hemimethylation assay to show that even in wild-type cells these sequences contain high levels of hemimethylated DNA, suggestive of poor maintenance methylation. We showed that Dnmt3a and/or -3b could restore methylation of these sequences to pretreatment levels following transient exposure of cells to 5-aza-CdR, whereas Dnmt1 by itself could not. We conclude that ongoing de novo methylation by Dnmt3a and/or Dnmt3b compensates for inefficient maintenance methylation by Dnmt1 of these endogenous repetitive sequences. Our results reveal a previously unrecognized degree of cooperativity among mammalian DNA methyltransferases in ES cells.


Figures

FIG. 1.
FIG. 1.
(A) Methylation-sensitive fingerprints of M1/3A/3B, M3A/3B, and M1 ES cell DNA after enzyme digestion with either RsaI, RsaI with HpaII, or RsaI with MspI for 16 h. Bands which appear to be hypomethylated only in lane 2 are indicated by solid arrows (class I). Bands which appear to be hypomethylated in both lanes 2 and 3 are indicated by open arrows (class II). Solid squares, functional Dnmt genes; open squares, inactivated genes. GCP1, -2, and -4 are GC-poor primers. (B) Southern blot analysis of genomic DNA from M1/3A/3B, M3A/3B, and M1 ES cells using isolated AP-PCR fragment CI-f as a probe. (C) Ms-SNuPE analysis for fragment CII-d from M1/3A/3B, M3A/3B, and M1 ES cell DNA. Quantitative methylation analysis of three CpG sites in CII-d was performed. The percent methylation given under each gel represents the average obtained for the three sites by using the following equation with PhosphorImager quantitation results: [C/(C + T)] × 100, where C is methylated and T is unmethylated. CpG sites are labeled; hatched boxes, repetitive sequences; arrows, PCR primers.
FIG. 2.
FIG. 2.
Sequence properties of hypomethylated fragments isolated from methylation-sensitive fingerprints in ES cells (see Fig. 1A). CpG sites are represented by tick marks; hatched boxes, repetitive sequences; upward-pointing arrows, HpaII sites. Stars indicate bands that are not included in Fig. 1A.
FIG. 3.
FIG. 3.
Patterns of methylation in ES cells at different regions. The methylation statuses of individual molecules of DNA from the CI-f (class I) and the CII-d and A-repeat (class II) regions were assessed by cloning of individual bisulfite-converted molecules followed by Ms-SNuPE or automated sequencing. CpG sites are represented by tick marks. Solid circles, methylated CpG dinucleotides; open circles, unmethylated CpG dinucleotides. Horizontal rows of circles indicate individual molecules that were sequenced after PCR amplification and cloning of bisulfite-treated DNA. Hatched boxes, repeat sequences.
FIG. 4.
FIG. 4.
Detection and quantitation of hemimethylation in individual cloned DNA molecules. The experimental approach used to detect hemimethylation in the ES cells consists of precutting genomic DNA with HpaII, followed by bisulfite treatment, then cloning individual PCR products, and assessing the methylation status of site 2 by Ms-SNuPE analysis. Shown are typical Ms-SNuPE results in which a signal in the T lane for a clone indicates hemimethylation, with the top strand being unmethylated. The presence of a signal in the C lane indicates that the site may be either hemimethylated (i.e., the bottom strand is unmethylated) or fully methylated. The distribution between these two scenarios is determined by calculation, assuming that there is an equal probability of hemimethylation of either the top or the bottom strand.
FIG. 5.
FIG. 5.
Distribution of methylation states at the CI-f and CII-d regions. (A) Overview of the procedure used to calculate distribution of methylation states (fully methylated, hemimethylated, and fully unmethylated) at a single CpG dinucleotide within an HpaII site, starting with the measurement of two experimental variables (P and S). A description of each variable is given in the leftmost column, along with the equation used to derive the calculated variables (see Materials and Methods). The second column illustrates the subset of methylation states representing that variable (open box), as well as all the other methylation states being assessed in that particular step (shaded box). The unmethylated CpG’s are absent in the cases of variables S and D, since the HpaII digestion removes these molecules from consideration at this step. The data obtained for the three cell lines for the measured variables P and S are shown in the columns on the right as percentages, followed by the absolute numbers of molecules assessed. Control experiments demonstrated that the top and bottom strands are equal in their methylation levels and rates (Fig. 3). On average, differences between the newly synthesized strand and the daughter strand after DNA replication should be distributed equally between the top and bottom strands in a large population of cells. (B) Distribution of methylation states of CI-f and CII-d. F, fully methylated; H, hemimethylated; U, fully unmethylated.
FIG. 6.
FIG. 6.
Recovery of methylation after 5-aza-CdR treatment. The indicated cell types were treated for 24 h with 3 × 10⁻⁷ M 5-aza-CdR; then the medium was changed, and the cells were propagated further. DNA was extracted at the times indicated after the drug was added to the cultures, and the methylation statuses of the CI-f and CII-d fragments were measured by Ms-SNuPE analysis. Results shown are average values from two separate experiments.
FIG. 7.
FIG. 7.
Methylation kinetics of newly synthesized DNA at CI-f and CII-d. ES cells containing the genes for the indicated DNA methyltransferases were pulsed for 1 h with BrdU. The pulse was then removed, and fresh medium was added to the cells during the chase period. DNA was extracted from the cells at various times after the pulse began and was immunoprecipitated to isolate the BrdU-containing DNA. The methylation statuses of HpaII sites in CI-f and CII-d at the indicated time points were determined by quantitative Ms-SNuPE analysis. Data are mean values from two to six experiments; error bars, standard deviations.

Similar articles

Cited by

References

    1. Adams, R. L. 1971. The relationship between synthesis and methylation of DNA in mouse fibroblasts. Biochim. Biophys. Acta 254:205–212. - PubMed
    1. Araujo, F. D., J. D. Knox, M. Szyf, G. B. Price, and M. Zannis-Hadjopoulos. 1998. Concurrent replication and methylation at mammalian origins of replication. Mol. Cell. Biol. 18:3475–3482. - PMC - PubMed
    1. Baylin, S. B., and J. G. Herman. 2000. DNA hypermethylation in tumorigenesis: epigenetics joins genetics. Trends Genet. 16:168–174. - PubMed
    1. Bender, C. M., M. L. Gonzalgo, F. A. Gonzales, C. T. Nguyen, K. D. Robertson, and P. A. Jones. 1999. Roles of cell division and gene transcription in the methylation of CpG islands. Mol. Cell. Biol. 19:6690–6698. - PMC - PubMed
    1. Bird, A., M. Taggart, M. Frommer, O. J. Miller, and D. Macleod. 1985. A fraction of the mouse genome that is derived from islands of nonmethylated, CpG-rich DNA. Cell 40:91–99. - PubMed

MeSH terms

LinkOut - more resources