

Role of poly(ADP-ribose) polymerase in rapid intracellular acidification induced by alkylating DNA damage
- PMID: 11756665
- PMCID: PMC117546
- DOI: 10.1073/pnas.012460399
Role of poly(ADP-ribose) polymerase in rapid intracellular acidification induced by alkylating DNA damage
Abstract
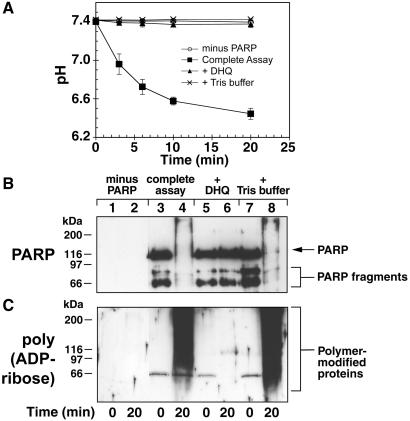
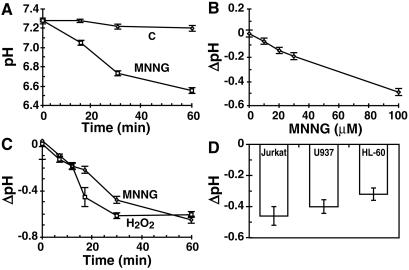
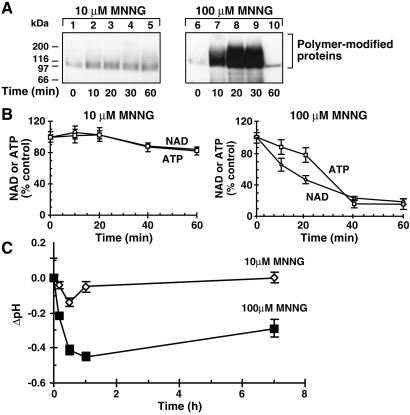
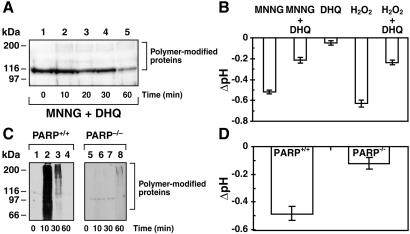
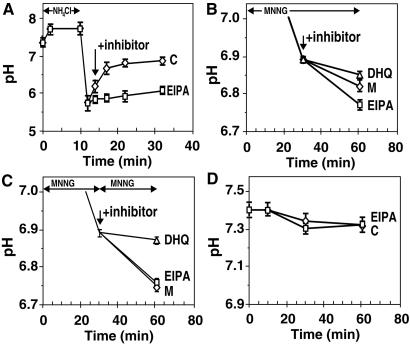
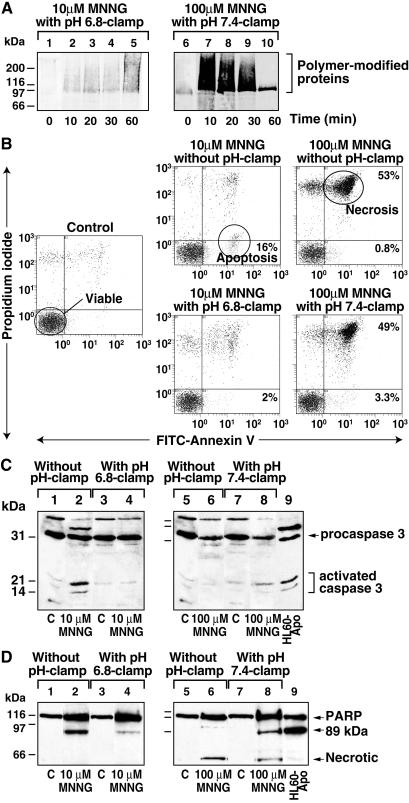
In response to high levels of DNA damage, catalytic activation of the nuclear enzyme poly(ADP-ribose) polymerase (PARP) triggers necrotic death because of rapid consumption of its substrate beta-nicotinamide adenine dinucleotide and consequent depletion of ATP. We examined whether there are other consequences of PARP activation that could contribute to cell death. Here, we show that PARP activation reaction in vitro becomes acidic with release of protons during hydrolysis of beta-nicotinamide adenine dinucleotide. In the cellular context, we show that Molt 3 cells respond to DNA damage by the alkylating agent N-methyl-N'-nitro-N-nitrosoguanidine (MNNG) with a dose-dependent acidification within 30 min. Whereas acidification by 0.15 pH units induced by 10 microM MNNG is reversed within 1 h, 100 , microinduced acidification by 0.5-0.6 pH units is persistent up to 7 h. Acidification is a general DNA damage response because H(2)O(2) exposure also acidifies Molt 3 cells, and MNNG causes acidification in Jurkat, U937, or HL-60 leukemia cells and in PARP(+/+) fibroblasts. Acidification is significantly decreased in the presence of PARP inhibitors or in PARP(-/-) fibroblasts, suggesting a major role for PARP activation in acidification. Inhibition of proton export through ATP-dependent Na(+)/H(+) exchanger is another major cause of acidification. Using the pH clamp method to either suppress or introduce changes in cellular pH, we show that brief acidification by 0.5-0.6 pH units may be a negative regulator of apoptosis while permitting necrotic death of cells with extensively damaged DNA.
Figures
Similar articles
-
Inhibition of poly(ADP-ribose) polymerase (PARP) influences the mode of sulfur mustard (SM)-induced cell death in HaCaT cells.Arch Toxicol. 2008 Jul;82(7):461-70. doi: 10.1007/s00204-007-0265-7. Epub 2007 Nov 29. Arch Toxicol. 2008. PMID: 18046540
-
Poly ADP-ribose polymerase (PARP) inhibitors transiently protect leukemia cells from alkylating agent induced cell death by three different effects.Eur J Med Res. 2003 Oct 22;8(10):438-50. Eur J Med Res. 2003. PMID: 14594650
-
Protein tyrosine nitration and poly(ADP-ribose) polymerase activation in N-methyl-N-nitro-N-nitrosoguanidine-treated thymocytes: implication for cytotoxicity.Toxicol Lett. 2007 May 15;170(3):203-13. doi: 10.1016/j.toxlet.2007.03.007. Epub 2007 Mar 14. Toxicol Lett. 2007. PMID: 17428624
-
Poly(ADP-ribose) polymerase-1 in the nervous system.Neurobiol Dis. 2000 Aug;7(4):225-39. doi: 10.1006/nbdi.2000.0324. Neurobiol Dis. 2000. PMID: 10964595 Review.
-
[Neuronal death: potential role of the nuclear enzyme, poly (ADP-ribose) polymerase].Bull Acad Natl Med. 2001;185(3):555-63; discussion 564-5. Bull Acad Natl Med. 2001. PMID: 11501263 Review. French.
Cited by
-
Role of poly(ADP-ribose) polymerase-1 activation in the pathogenesis of diabetic complications: endothelial dysfunction, as a common underlying theme.Antioxid Redox Signal. 2005 Nov-Dec;7(11-12):1568-80. doi: 10.1089/ars.2005.7.1568. Antioxid Redox Signal. 2005. PMID: 16356120 Free PMC article. Review.
-
P2X7 receptor-mediated PARP1 activity regulates astroglial death in the rat hippocampus following status epilepticus.Front Cell Neurosci. 2015 Sep 4;9:352. doi: 10.3389/fncel.2015.00352. eCollection 2015. Front Cell Neurosci. 2015. PMID: 26388738 Free PMC article.
-
NAD+ enhancers as therapeutic agents in the cardiorenal axis.Cell Commun Signal. 2024 Nov 8;22(1):537. doi: 10.1186/s12964-024-01903-4. Cell Commun Signal. 2024. PMID: 39516787 Free PMC article. Review.
-
Antitumor Activity of the Cardiac Glycoside αlDiginoside by Modulating Mcl-1 in Human Oral Squamous Cell Carcinoma Cells.Int J Mol Sci. 2020 Oct 26;21(21):7947. doi: 10.3390/ijms21217947. Int J Mol Sci. 2020. PMID: 33114727 Free PMC article.
-
Resistance to PARP-Inhibitors in Cancer Therapy.Front Pharmacol. 2013 Feb 27;4:18. doi: 10.3389/fphar.2013.00018. eCollection 2013. Front Pharmacol. 2013. PMID: 23450678 Free PMC article.
References
-
- Amé J C, Jacobson E L, Jacobson M K. In: From DNA Damage and Stress Signalling to Cell Death: Poly ADP-Ribosylation Reactions. de Murcia G, Shall S, editors. New York: Oxford Univ. Press; 2000. pp. 1–34.
-
- Herceg Z, Wang Z Q. Mutat Res. 2001;477:97–110. - PubMed
-
- Shall S, de Murcia G. Mutat Res. 2000;460:1–15. - PubMed
-
- Pieper A A, Verma A, Zhang J, Snyder S H. Trends Pharmacol Sci. 1999;20:171–181. - PubMed
-
- Le Rhun Y, Kirkland J B, Shah G M. Biochem Biophys Res Commun. 1998;245:1–10. - PubMed
Publication types
MeSH terms
Substances
LinkOut - more resources
Full Text Sources
Molecular Biology Databases
Research Materials
