

doi: 10.1073/pnas.012589499.
Epub 2001 Dec 26.
Quaternary structure of human fatty acid synthase by electron cryomicroscopy
Affiliations
- PMID: 11756679
- PMCID: PMC117528
- DOI: 10.1073/pnas.012589499
Item in Clipboard
Quaternary structure of human fatty acid synthase by electron cryomicroscopy
Proc Natl Acad Sci U S A.
.
Abstract
We present the first three-dimensional reconstruction of human fatty acid synthase obtained by electron cryomicroscopy and single-particle image processing. The structure shows that the synthase is composed of two monomers, arranged in an antiparallel orientation, which is consistent with biochemical data. The monomers are connected to each other at their middle by a bridge of density, a site proposed to be the combination of the interdomain regions of the two monomers. Each monomer subunit appears to be subdivided into three structural domains. With this reconstruction of the synthase, we propose a location for the enzyme's two fatty acid synthesis sites.
Figures
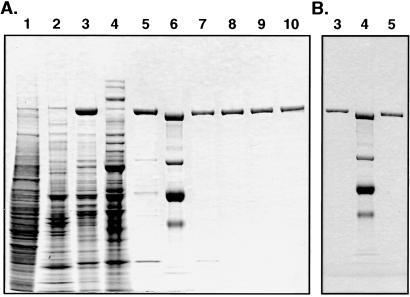
SDS/PAGE analyses of FAS purified from the breast cancer cell line
ZR75–1. (A) Various fractions were subjected to
SDS/PAGE analysis (4–12% gradient), and the gel then was stained
with Coomassie blue. Lane 1, soluble extract (25 μg); lanes
2, 3, and 4, HiLoad 26/10 Q-Sepharose fractions 29, 30–35, and 36
(10 μg of each fraction); lane 5, Superose-6 fraction (2 μg); lane
6, protein standard (molecular masses: 217, 123, 71, and 48
kDa); lanes 7, 8, 9, and 10, UNO-Q-6 fractions 56–59 (0.6 μg each).
(B) For electron cryomicroscopic examination, the
purified FAS (lane 5, 0.6 μg) was applied to an UNO-Q-6 column and
fraction 3 (0.6 μg) was analyzed (lane 3). Lane 4 is a protein
standard.
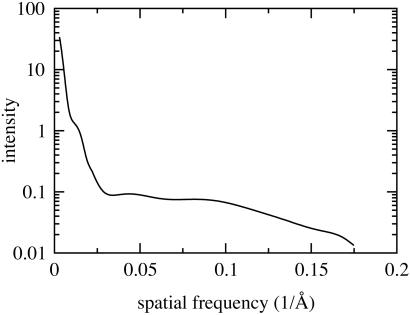
X-ray solution scattering intensity curve of FAS collected at the
Stanford Synchrotron Radiation Laboratory on beamline BL 4-2. The
scattering curve exhibits a shoulder at 1/70 Å−1, which
is characteristic for a dimeric particle. The curve was obtained by
combining two separate scattering curves as explained in
Materials and Methods.
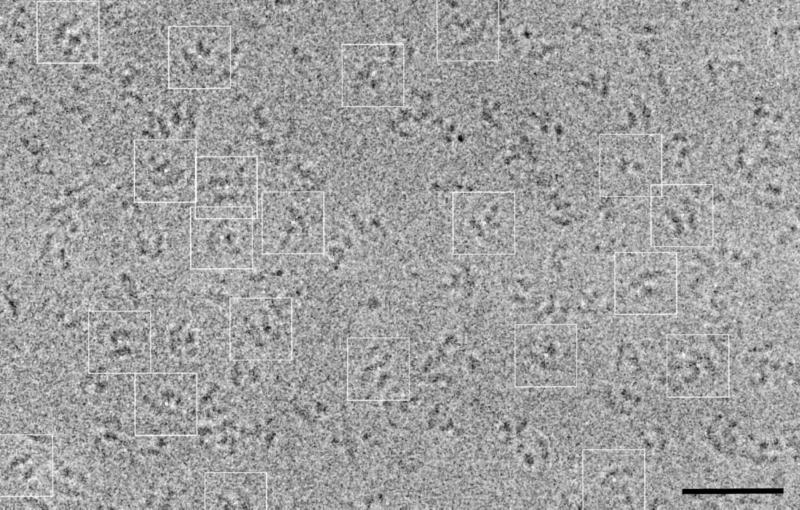
Typical micrograph of FAS embedded in vitreou ice and recorded at
2.7-μm defocus. The image shown was median-filtered by using a 3
× 3-pixel window to facilitate identification and selection of the
molecules. For clarity, several particle images that were selected for
image processing have been boxed out. These particles show FAS in
different views (e.g. double-arched and dumbbell-shaped). The
accompanying close-to-focus micrograph of this area was used to select
particles from for image processing. (Bar, 500 Å.)
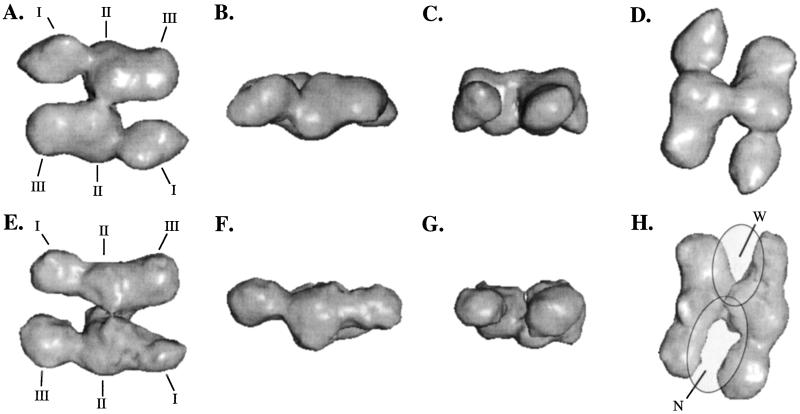
3D reconstruction of FAS obtained with (A–D) and
without (E–H) applying C2 symmetry. The
surface renderings were done at 100% of the molecular mass assuming
1.23 Å3/Da. From left to right, different views of the
molecule are shown, i.e., top view (A and
E), side view (B and F),
end-on view (C and G), and the view
corresponding to the double-arch view visible in Fig. 3
(D and H). Individual domains of the
subunits have been indicated as I–III (A and
E). The far-right bottom view shows the two clefts
formed by the monomers labeled as narrow (N) and wide (W). Proposed
locations of the active sites in FAS are indicated by the two gray
semitransparent oval regions.
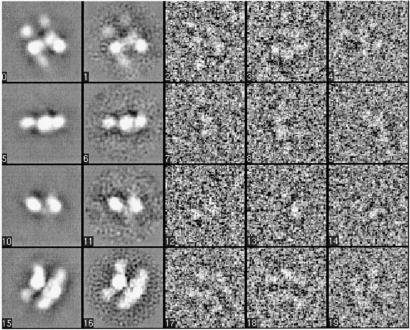
Excerpts from the refinement of FAS using EMAN. Shown
are (from left to right) projections of the 3D model along with the
corresponding class averages as well as three particle images from each
class. The particle images displayed differ by an in-plane rotation.
Note that during the alignment, however, this difference is taken care
of. The rows show top, side, and end-on views of FAS; the
Bottom shows the characteristic view of two parallel arcs as
seen in Fig. 2.
References
Publication types
MeSH terms
Substances
Grants and funding
LinkOut - more resources
Full Text Sources
Molecular Biology Databases
